| 3-Year Average ROI |  | | % of PSUs earned for each metric | | | | | | | | | | | | | | | | | | | Threshold | Target | 150% Payout | Maximum | | | | | | | | | | | | 3-Year Relative TSR Percentile (1) | | | | | % of PSUs earned | | | | | | 06 | | | COMPENSATION DISCUSSION
AND ANALYSIS
| | | | | | | |
2020-2022 Performance Plan Awards
(1)Three-year Relative TSR vs the 2021 Compensation Peer Group companies for period of January 1, 2021 – December 31, 2023. In general, formulaic plans provide that the MDCC has discretionary authority to NEOsexclude unusual or infrequently occurring items, extraordinary items, and the cumulative effect of changes in accounting treatment when determining performance attainment where warranted by events and/or business conditions. 2021-2023 PERFORMANCE PLAN AWARDS TO NEOS The following table presents the number of Performance Stock Units granted to the NEOs for the 2020-20222021-2023 performance period, along with their respective grant date value: | | | | | | | | | | | | | NEO | Target # of PSUs (1) | Grant Date Value(2) | | Mr. Adamczyk | 35,300 | | | $ | 7,502,309 | | | Mr. Lewis | 11,100 | | | $ | 2,359,083 | | | Ms. Madden | 11,100 | | | $ | 2,359,083 | | | Ms. Dallara | 9,200 | | | $ | 1,955,276 | | | Mr. Madsen | 7,400 | | | $ | 1,572,722 | |
(1)All officer PSUs awarded on March 15, 2021. (2)The grant date unit value asfor awards made on March 15, 2021 of February 14, 2020: | | | | | | | | | | | | | NEO | | # of PSUs(1) | | | Grant Date Value(2) | | | | | | | | | | | | | | | Mr. Adamczyk | | | 37,200 | | | $ | 7,014,804 | | | | | Mr. Lewis | | | 11,500 | | | $ | 2,168,555 | | | | | Ms. Madden | | | 11,500 | | | $ | 2,168,555 | | | | | Mr. Gautam | | | 11,200 | | | $ | 2,111,984 | | | | | Mr. Waldron | | | 9,300 | | | $ | 1,753,701 | |
(1) | All officer PSUs awarded on February 14, 2020.
|
(2) | The grant date unit value for awards made on February 14, 2020, of $188.57 was determined based on the fair market value of Honeywell stock on the date of grant of $180.92 for the three internal financial metrics, and a value of $211.53 for the relative TSR metric, based on a multifactor Monte Carlo simulation conducted by an independent valuation service provider. The grant date values reflect the original award values for the grants made in February 2020. The subsequent pandemic-related adjustment to the plan financial metrics for this cycle, made in the first quarter of 2021, is considered an award modification that will result in incremental accounting value for these awards that will be reflected as 2021 compensation on the Summary Compensation Table in the next annual Proxy Statement.
|
$212.53 was determined based on the fair market value of Honeywell stock on the date of grant of $214.85 for the three internal financial metrics, and a value of $205.57 for the Relative TSR metric, based on a multifactor Monte Carlo simulation conducted by an independent valuation service provider. At the end of the performance period, the total number of PSUs earned for each NEO shall be determined on a formulaic basis. Dividend equivalents applied during the vesting period as additional PSUs will be adjusted based on the final number of PSUs earned. In determining the final distributions of earned awards, 50% of the resulting PSUs earned will be converted to shares of Company common stock and issued to each NEO, subject to the holding period requirements for officers. The remaining 50% shall be converted to cash based on the fair market value of a share of Honeywell stock on the last day of the performance period and paid to each NEO in the first quarter following the end of the performance period.
I
| | | | | | | | | | 68 | | Notice and Proxy Statement | 2022 |
COMPENSATION DISCUSSION AND ANALYSIS 2020-2022 PERFORMANCE PLAN As fully discussed in Honeywell's 2021 Proxy Statement, on March 15, 2021, the MDCC approved an adjustment to the three financial metrics under the 2020-2022 Performance Plan due to the extraordinary impacts of the COVID-19 pandemic, which rendered the original financial targets unattainable within months of them being set in February 2020. This change was necessary to correct a misalignment between the pay opportunity and the range of performance reasonably attainable for this cycle. No changes were made to the original three-year Relative TSR goal. The recast financial targets were fully disclosed in the 2021 proxy statement. Coincident with this change, the upside total payout opportunity for this performance cycle was reduced by 40%. This action was reviewed with shareowners during 2021 outreach meetings and broadly viewed as appropriate under the circumstances, with recognition that adverse pandemic-related impacts on incentive plans were not unique to Honeywell and that thoughtful recalibrations were appropriate in industries hardest hit by the COVID-19 pandemic. In arriving at this decision in the first quarter of 2021, the MDCC took into consideration management’s response and efforts to mitigate pandemic impacts in 2020 by quickly implementing cost controls (such as no merit increases in 2020 and 10% salary reductions from March 31, 2020 through November 1, 2020.) and pivoting to new opportunities aimed at positioning the Company for post-pandemic growth and shareowner value creation, which resulted in a total shareowner return of 23% for 2020. Consideration was also given to the fact that the 2018-2020 performance cycle and 2020 ICP awards were paid out without adjustment, despite being significantly adversely impacted by the COVID-19 pandemic. The MDCC also determined that this change was in alignment with the experience of both shareowners and employees in 2020. Since the pandemic-driven low of $103.86 on March 23, 2020, Honeywell’s stock price appreciated 105% to $212.70 as of December 31, 2020. The adjustment approach used for the NEOs was also extended to the cash-based performance units issued to other executive and management-level employees of the Company in 2020. While the original grant date value of the 2020-2022 PSU awards issued in February 2020 to the NEOs was already reported as 2020 compensation on the Summary Compensation Table included in the Company's 2021 proxy statement (except for Ms. Dallara and Mr. Madsen, who were not NEOs in 2020), and no new awards were made, the aforementioned adjustment to the financial metrics is considered an award modification that gives rise to incremental reportable compensation in the year the modification was made under SEC rules. As such, the calculated incremental fair value of the 2020-2022 PSU award modification to the NEOs, determined as of March 15, 2021, is included as incremental 2021 compensation in the Stock Awards column of the Summary Compensation Table and in the Grants of Plan-Based Awards Table in this proxy statement as follows: | | | | | | | NEO | 2020-2022 Performance Stock Units Modification (1) | | Mr. Adamczyk | $4,754,160 | | | Mr. Lewis | $1,469,700 | | | Ms. Madden | $1,469,700 | | | Ms. Dallara | $1,337,108 | | | Mr. Madsen | $898,594 | |
(1)Represents the incremental fair value, determined as of the March 15, 2021 modification date, in accordance with FASB ASC Topic 718 for a Type III modification, with no offset for forfeiture of the portion of the original award that became improbable of attainment due to the impacts from the COVID-19 pandemic. The MDCC viewed this adjustment as a realignment to the intended grant date values originally reported as 2020 compensation, which differs from the reported values on the Summary Compensation Table under SEC rules.
| | | | | | | | | | | | | Notice and Proxy Statement | 2022 | | 69 |
COMPENSATION DISCUSSION AND ANALYSIS 2019-2021 PERFORMANCE PLAN ASSESSMENT | | | | | 2019-2021 SUMMARY | | •Three-year cumulative Shareowner return of 55.9% (61st percentile vs. relevant Compensation Peer Group) •Financial metric attainment impacted by COVID-19 (three-year growth goals set pre-pandemic) •MDCC approved 2019-2021 PSU payout = 87% of target (CEO and Corporate officers) | |
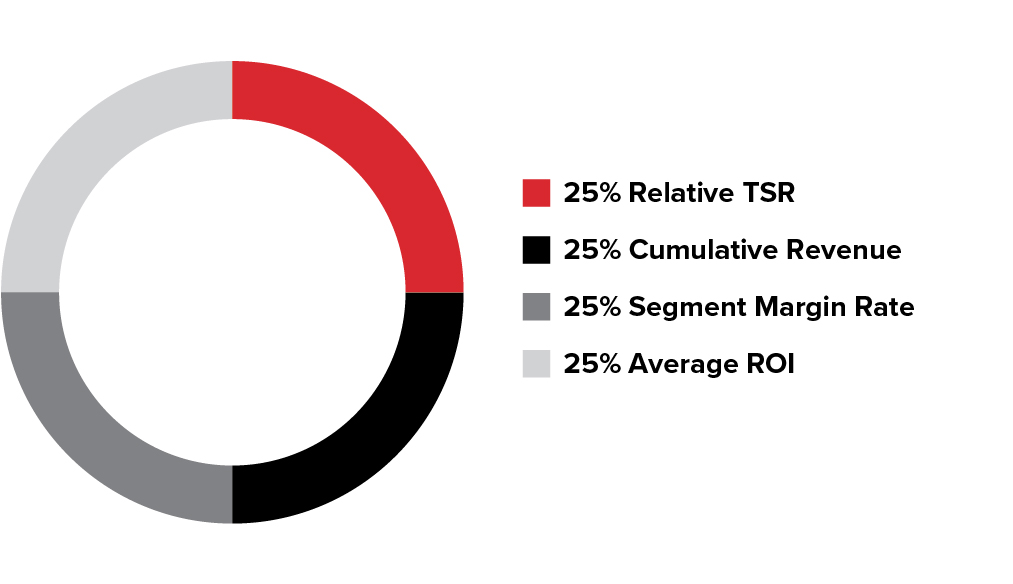
In February 2019, Performance Plan awards for a three-year performance period of January 1, 2019 through December 31, 2021 were granted to executive officers in the form of Performance Stock Units (PSUs). This applied to all NEOs except Mr. Madsen, who was not an executive officer in February 2019. Three-year performance goals were established for cumulative revenue, average segment margin rate, average return on investment (ROI) and TSR relative to the 2019 Compensation Peer Group. Each of these goals was equally weighted (25% each). The target performance levels were established before the COVID-19 pandemic as follows: 3.1% compound annual revenue growth, 80 basis points of segment margin expansion, and 140 basis points of ROI expansion. Goals were developed for each of the three years, with the first year aligned to the midpoint of external guidance, and growth rates for the second and third years in the cycle aligned with Honeywell’s long-range plan. Target performance levels were aimed at driving year-over-year growth and meaningful improvements in Honeywell operations over the three-year period. By the fourth quarter of 2020, it became clear that the 2019-2021 financial metrics were heavily and adversely impacted by the COVID-19 pandemic, especially cumulative revenue and ROI, which were all but certain to fall below threshold levels. Projections at that time suggested that it may not be possible to offset the downward drag of pandemic-related 2020 results on the three-year cumulative goals, despite strong performance in 2019. In contrast, the three-year Relative TSR metric was tracking above target, in tandem and alignment with the shareowner experience. Since the 2019-2021 PSU performance period was nearly two-thirds completed, the plan-basis Relative TSR metric was tracking above target, and there was increasing optimism regarding the post-pandemic business conditions, the MDCC took a conservative approach and continued monitoring performance through the end of the cycle before making any decision. Throughout 2021, the MDCC was provided with, and studied, updates on the 2019-2021 Performance Plan at its February, March, September, and December 2021 meetings. The MDCC conducted rigorous due diligence in considering how to address the following external and internal factors: •The impact of the extended duration of the pandemic and unprecedented global supply chain issues. •Three-year TSR performance for shareowners both on an absolute basis and relative to the Compensation Peer Group. •Heightened human capital risks brought on by intensifying competition for talent. •Incentive plan adjustments disclosed by companies within the Fortune 100. •Honeywell executive-level retention and turnover information as compared to prior years. •Holistic view of compensation actions over the three-year period and the degree of impact from the pandemic. PSU Formulaic Calculation In February 2022, the MDCC reviewed the outcomes for the 2019-2021 executive officer PSUs, determined as of December 31, 2021, calculated without taking into consideration the unusual and extraordinary impacts of the COVID-19 pandemic. The following table displays the formulaic 2019-2021 PSU calculation payout results: | | | | | | | | | | | | | | | | | | | | | | | | | | | | | | | | | | | | | | | | | Total Honeywell | Threshold | Target | Maximum | | Actual Plan Performance(1) | | Payout
Factor | Weight | Weighted
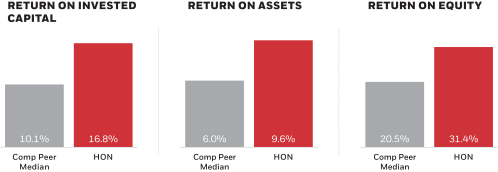
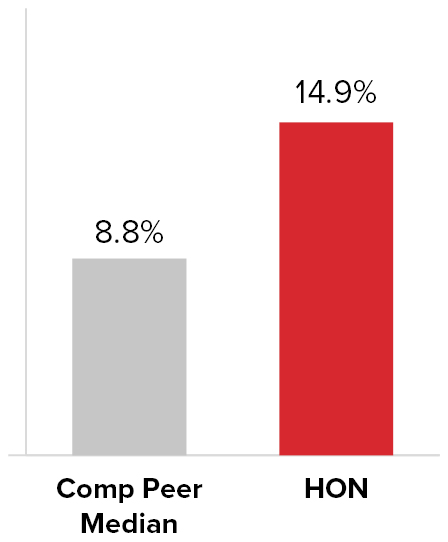
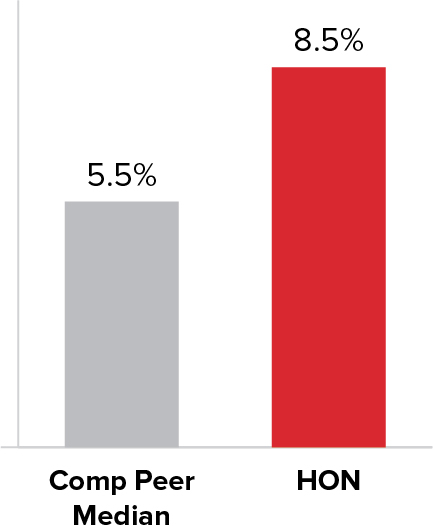
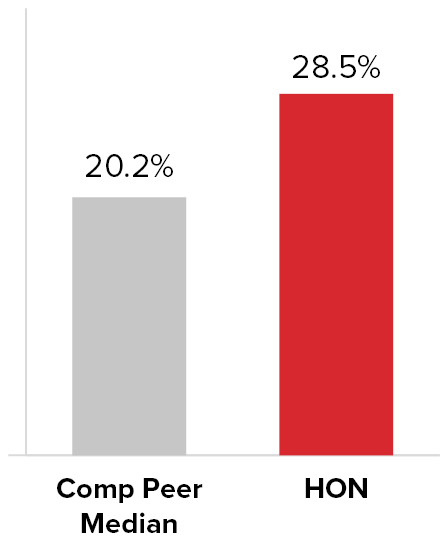
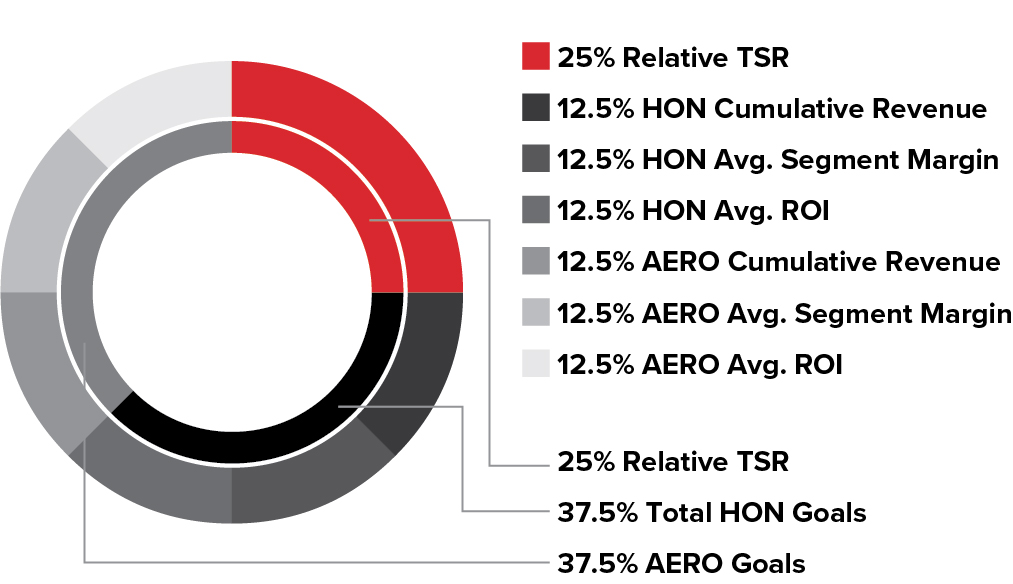
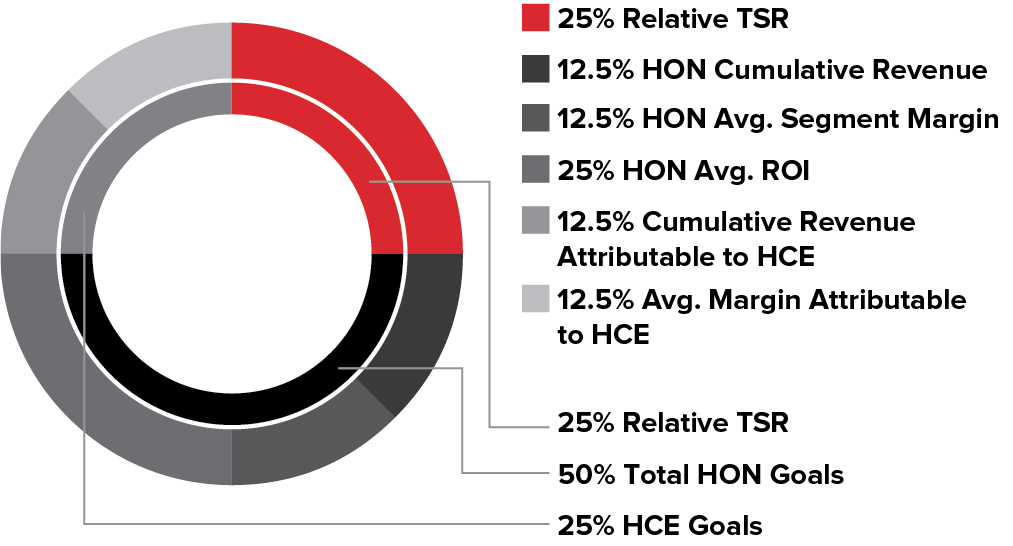
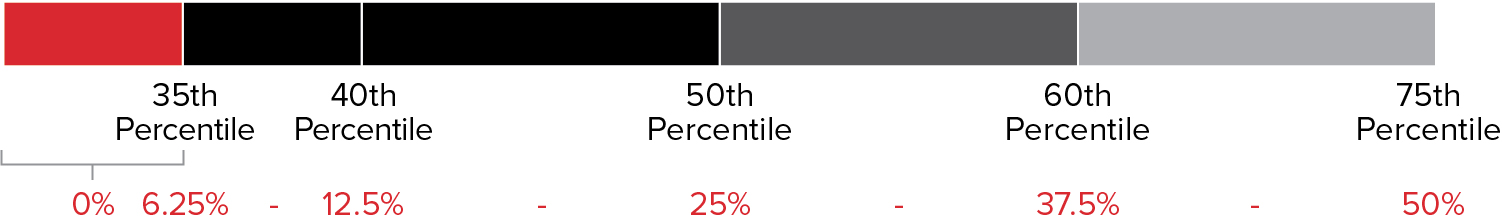
Payout % | | 3-Year Cumulative Revenue ($M) | $108,543 | $112,480 | $116,417 | | $103,775 | | 0 | % | 25 | % | 0 | % | | 3-Year Average Segment Margin Rate | 20.7% | 21.2% | >= 21.7% | | 20.8 | % | | 60 | % | 25 | % | 15 | % | | 3-Year Average ROI | 23.4% | 24.2% | >= 24.9% | | 22.1 | % | | 0 | % | 25 | % | 0 | % | | 3-Year Relative TSR | 35th Percentile | 50th Percentile | >= 75th Percentile | | 61st Percentile | | 154 | % | 25 | % | 39 | % | | | | | | | | | | | | Total PSU Calculated Percentage–Corporate NEOs (Messrs. Adamczyk and Lewis, and Ms. Madden)–Based 100% on performance against Total Honeywell goals | 54 | % | | | | | | | | | | | Total PSU Calculated Percentage–HCE Business Unit (Ms. Dallara)–Financial metrics portion based 67% on Total Honeywell and 33% on Business Unit goals(2) | 71 | % | | | | | | | | | | | (1)Consistent with goal setting parameters, revenue was adjusted to exclude the impact of corporate transactions and fluctuations in foreign currency. Segment margin was adjusted to exclude the impact of corporate transactions. ROI was adjusted to exclude the impact of corporate transactions and the impact of pension income and asset fluctuations. | (2)Business Unit goals are based on the business unit’s performance on three-year revenue and segment margin performance. |
| | | | | | | | | | 70 | | Notice and Proxy Statement | 2022 |
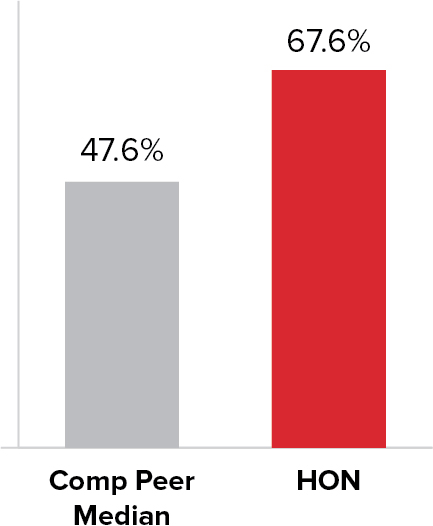
COMPENSATION DISCUSSION AND ANALYSIS Honeywell’s plan-basis TSR of 55.9% was above the median of our 2019 Compensation Peer Group for the three-year performance period of January 1, 2019 - December 31, 2021), as follows: | | | | | | | | | | Company Name | 3-Year TSR(1) | 3-Year Relative
Percentile Ranking | | Johnson Controls International plc | 157.2 | % | 100 | % | | Eaton Corporation plc | 155.0 | % | 92 | % | | Deere & Company | 130.1 | % | 85 | % | | Illinois Tool Works, Inc. | 93.8 | % | 77 | % | | Caterpillar, Inc. | 66.5 | % | 69 | % | | Emerson Electric Co. | 56.6 | % | 62 | % | | General Electric Company | 36.3 | % | 54 | % | | Raytheon Technologies Corp. | 34.0 | % | 46 | % | | Lockheed Martin Corporation | 30.5 | % | 38 | % | | General Dynamics Corporation | 29.4 | % | 31 | % | | 3M Company | (0.6) | % | 23 | % | | Phillips 66 | (12.0) | % | 15 | % | | Schlumberger Limited | (22.2) | % | 8 | % | | The Boeing Company | (43.4) | % | 0 | % | | 2019 Compensation Peer Group Median | 35.1 | % | | | Honeywell International Inc. | 55.9 | % | 61 | % |
(1) Three-year TSR on ‘plan basis’, which uses a 30-trading day average of stock prices from the beginning, and to the end, of the three-year performance period. Payout Decision In February 2022, the MDCC reviewed and assessed the overall formulaic PSU calculation for the 2019-2021 PSU cycle for the NEOs that received them. The MDCC noted that the unusual and extraordinary adverse impacts from the COVID-19 pandemic resulted in zero or low payouts on the three original financial metrics (e.g., 0% for Corporate three-year Cumulative Revenue and three-year Average ROI) that did not adequately or appropriately reflect the performance of the Company over the period and management’s performance and response to the COVID-19 pandemic. The minimal calculated payouts for the three financial metrics were also not in tandem with the shareowner experience, as Honeywell’s Relative TSR for the three-year period ranked above the median of our peer group companies, at the 61st percentile. In response, the MDCC discussed several alternatives for the 2019-2021 PSUs to better align pay with performance. Alternatives discussed included: (i) adjusting the goals or measurement against them by quantifying the impacts of the pandemic on the original targets; (ii) basing the payout purely on Relative TSR; (iii) aligning the PSU payouts with the payouts determined under the 2019-2021 performance cash units to non-officer executives for the same time period, or (iv) modifying the weighting applied in the calculation to each of the four original three-year goals. The Committee also discussed making no changes and allowing the misaligned payouts to occur. Upon fully assessing and evaluating performance and risks for the full 2019-2021 performance period, in February 2022 the MDCC exercised its authority under the plan to make an appropriate adjustment to the weighting applied to the metrics under the plan for only this 2019-2021 cycle. The original financial goals remained in the calculation to preserve the integrity of the program, but their weighting was reduced from 75% to 50%, to recognize that the pandemic impacts were not contemplated when the goals were originally established, and that the results were adversely and materially impacted by global market forces. The weight applied to the three-year Relative TSR goal was increased from 25% to 50%, to better align with the shareowner experience. The MDCC determined that the payouts based on this approach better reflected leadership performance and long-term actions taken over the measurement period, as well as the investor experience, while still resulting in a below target payout for this unprecedented and challenging performance period. The MDCC also recognized that this was the last overlapping cycle to be severely impacted by the COVID-19 pandemic, and that regular compensation program awards made in 2021, as discussed earlier in this Proxy Statement, reflect the restoration of the ‘normal state’ executive compensation program structure and design elements that shareowners have overwhelmingly supported since being fully implemented in 2018.
| | | | | | | | | | | | | Notice and Proxy Statement | 2022 | | 71 |
COMPENSATION DISCUSSION AND ANALYSIS The following table displays the 2019-2021 PSU calculation payout for Corporate NEOs with the adjusted weighting, as determined by the MDCC: | | | | | | | | | | | | | | | | | | | | | | | | | | | | | | | | | | | | | | | | | Total Honeywell | Threshold | Target | Maximum | | Actual Plan Performance(1) | | Payout
Factor | Weight (adjusted) | Weighted
Payout % | | 3-Year Cumulative Revenue ($M) | $108,543 | $112,480 | $116,417 | | $103,775 | | 0 | % | 16.67 | % | 0 | % | | 3-Year Average Segment Margin Rate | 20.7% | 21.2% | >= 21.7% | | 20.8 | % | | 60 | % | 16.67 | % | 10 | % | | 3-Year Average ROI | 23.4% | 24.2% | >= 24.9% | | 22.1 | % | | 0 | % | 16.67 | % | 0 | % | | 3-Year Relative TSR | 35th Percentile | 50th Percentile | >= 75th Percentile | | 61st Percentile | | 154 | % | 50 | % | 77 | % | | | | | | | | | | | | Total PSU Calculated Percentage–Corporate NEOs (Messrs. Adamczyk and Lewis, and Ms. Madden)–Based 100% on performance against Total Honeywell goals | 87 | % | | | | | | | | | | | | Total PSU Calculated Percentage–HCE Business Unit (Ms. Dallara)–Financial metrics portion based 67% on Total Honeywell and 33% on Business Unit goals | 99 | % | | | | | | | | | | | (1)Consistent with goal setting parameters, revenue was adjusted to exclude the impact of corporate transactions and fluctuations in foreign currency. Segment margin was adjusted to exclude the impact of corporate transactions. ROI was adjusted to exclude the impact of corporate transactions and the impact of pension income and asset fluctuations. |
The payout percentage for HCE (Ms. Dallara) differed from the Corporate NEOs as the financial metrics portion of her award was based on performance against both Total Honeywell metrics and metrics established for the HCE business unit. Detailed metrics for the HCE business unit are not disclosed because we have determined that such information involves confidential commercial and financial information, the disclosure of which would result in competitive harm for Honeywell. 2019-2021 PSU Payouts (Messrs. Adamczyk and Lewis and Mses. Madden and Dallara) Based on the final approved award payout percentages for the 2019-2021 performance period for those NEOs who received their 2019-2021 Performance Plan award in the form of PSUs, the MDCC approved the following individual awards to the NEOs: | | | | | | | | | | | | | NEO | 2019-2021 PSUs at Target (1) | Total Payout % | Total 2019-2021 PSUs Earned | | Mr. Adamczyk | 43,640 | 87 | % | 37,967 | | | Mr. Lewis | 11,595 | 87 | % | 10,088 | | | Ms. Madden | 11,595 | 87 | % | 10,088 | | | Ms. Dallara | 8,855 | 99 | % | 8,766 | |
(1)Includes additional PSUs from dividend equivalents. Earned awards became fully vested on February 26, 2022. 50% of the PSUs earned were converted to shares of Honeywell common stock, with the net shares paid subject to an additional one-year holding period, in accordance with the officer stock ownership guidelines. The remaining 50% was converted to cash based on the closing stock price of Honeywell common stock on December 31, 2021 and paid in March 2022. 2019-2021 Performance Cash Unit Payouts (Mr. Madsen only) In February 2022, the MDCC also reviewed the calculated outcomes for the 2019-2021 Performance Plan Cash Units (PCUs) issued to 490 non-officer executives in 2019 (which included Mr. Madsen, who was a non-officer at the time of grant). The following summarizes the structure of the 2019-2021 PCU awards, which was different from the officer PSUs described above: | | | | | | | Eligible Participants | •Non-Officers (Executives) | | Form of Award | •PCUs denominated at $100 per unit and settled in cash | | Mix of Goals | •Equally weighted between Total Honeywell and Business Unit goals (50% Total Honeywell and 50% Aerospace) | | Measurement and Goal Weighting | •Measurement for three, single years, 2019, 2020 and 2021*, with the total payout factor equal to the average of the three years. Cash payout is delayed to the end of the 3 years. For each year, 100% weight on financial metrics with 33.3% weight on each of three Corporate goals: –1-Year Cumulative Revenue (for each of 2019, 2020, and 2021) –1-Year Average Segment Margin Rate (for each of 2019, 2020, and 2021) –1-Year Average ROI (for each of 2019, 2020, and 2021) | | Payout Cap | •120% of target | | Stock Performance Goal | •Not applicable |
*The MDCC set the annual target for the 2021 annual measurement period in March 2021 based on 2021 financial guidance and annual operating plan targets established in the first quarter of 2021. Previously established annual goals for 2019 or 2020 remained unchanged, despite 2020 also being significantly impacted by the pandemic. | | | | | | | | | | 72 | | Notice and Proxy Statement | 2022 |
COMPENSATION DISCUSSION AND ANALYSIS The following table displays the results of the 2019-2021 Performance Plan calculation for all Aerospace business unit executives (non-officer) who received PCUs in 2019 (including Mr. Madsen): | | | | | | | | | | | | | | | | | | | | | | | | | | | AERO Performance Goals (1) | 2019 Performance | 2020 Performance (Pandemic Impacted) | 2021 Performance | | 3-Year Average Performance(2) | | Weight | Weighted Payout % | | Revenue | 163 | % | 0 | % | 82% | | 81.7 | % | | 33.33 | % | 27 | % | | Segment Margin Rate | 180 | % | 100 | % | 160% | | 146.7 | % | | 33.33 | % | 49 | % | | ROI | 163 | % | 0 | % | 50% | | 71.0 | % | | 33.33 | % | 24 | % | | | | | | | | | | | Total Earned Cash Unit Payout Percentage – AERO executives (non-officer), includes Mr. Madsen as non-officer in 2019 | 100 | % |
(1)Results for AERO executives based 50% on performance against Total Honeywell targets and 50% on performance against Aerospace targets. (2)Consistent with goal setting parameters, revenue was adjusted to exclude the impact of corporate transactions and fluctuations in foreign currency. Segment margin was adjusted to exclude the impact of corporate transactions. ROI was adjusted to exclude the impact of corporate transactions and the impact of pension income and asset fluctuations. Based on the final approved award payout percentage for non-officer Aerospace executives who received a 2019-2021 Performance Plan award in the form of performance cash units, the following individual award was earned by Mr. Madsen: | | | | | | | | | | | | | | | | NEO | 2019-2021 Performance Cash Units at Target | Value Per
Unit | Total Earned
Award % | Total 2019-2021 Performance Cash Award Earned | | Mr. Madsen | 5,110 | $100 | 100 | % | $511,000 |
The earned award for Mr. Madsen became fully vested on February 26, 2022 and was paid in cash in March 2022. In accordance with SEC disclosure requirements for cash-based awards, 100% of the earned cash award for Mr. Madsen for the 2019-2021 performance period is included as 2021 Non-Equity Incentive Compensation on the Summary Compensation Table, even though originally granted in 2019. The MDCC considered this 2019-2021 cash unit award as part of Mr. Madsen's 2019 total annual direct compensation (in the year it was granted), which differs from how it is reported on the Summary Compensation Table. Mr. Madsen became an Executive Officer in October 2019, and he has received PSU awards since then. Stock options granted to the NEOs in February 20202021 represented 35% of their total annual LTI value and mix. The MDCC believes that stock options continue to be an important element for focusing executives on actions that drive long-term stock appreciation that is directly aligned with the interests of our shareowners. Stock options granted to Mr. Adamczyk and all the otherOther NEOs vest 25% per year over four years and have a 10-year term to exercise. The strike price for the 20202021 annual stock options is $180.92,$202.72, which was the fair market value of Honeywell stock on the date of grant (February 14, 2020)12, 2021). The grant date value was determined using a Black-Scholesfair value of $21.41 per share asa stock option was determined by a third-party valuation company.company using a Black-Scholes valuation method. The following table presents the number of stock options granted to the NEOs along with their respective grant date values. | | | | | | | | | | | | | NEO | | # of Stock Options Awarded (1) | | | Grant Date Value (2) | | | | | | | | | | | | | | | Mr. Adamczyk | | | 228,800 | | | $ | 4,898,608 | | | | | Mr. Lewis | | | 70,200 | | | $ | 1,502,982 | | | | | Ms. Madden | | | 70,200 | | | $ | 1,502,982 | | | | | Mr. Gautam | | | 68,600 | | | $ | 1,468,726 | | | | | Mr. Waldron | | | 57,200 | | | $ | 1,224,652 | |
| | | | | | | | | | | | | NEO | # of Stock Options (1) | Grant Date Value (2) | | Mr. Adamczyk | 163,500 | | $ | 5,248,350 | | | Mr. Lewis | 51,200 | | $ | 1,643,520 | | | Ms. Madden | 51,200 | | $ | 1,643,520 | | | Ms. Dallara | 42,500 | | $ | 1,364,250 | | | Mr. Madsen | 34,100 | | $ | 1,094,610 | |
(1)All officer stock options awarded on February 12, 2021. Options vest 25% per year over four years from the grant date. Upon exercise, stock options are settled in shares of Honeywell stock with the NEO required to hold the resulting net gain shares at least one year before being able to sell them. (2)The grant date value was determined using a Black-Scholes value of $32.10 per option. (1) | All officer stock options awarded on February 14, 2020. Options vest 25% per year over four years from the grant date.
|
(2) | The grant date value was determined using a Black-Scholes value of $21.41 per share.
|
| | | | | | | | | 
| | |Notice and Proxy Statement | 2021 2022
| | 64
73 |
COMPENSATION DISCUSSION AND ANALYSIS
| | | 06 | | | COMPENSATION DISCUSSION
AND ANALYSIS
|
IRESTRICTED STOCK UNITS
RSUs granted to the NEOs in February 20202021 represented 15% of their total annual LTI value and mix. RSUs granted to Mr. Adamczyk, and all the otherOther NEOs, vest 33%, 33%, 34% on the second, fourth, and sixth anniversaries of the grant date, respectively. This extended vesting period is designed to strengthen retention. The following table presents the number of RSUs granted to the NEOs in 20202021 along with their respective grant date values. | | | | | | | | | | | | | NEO | | Target # of RSUs (1)(2) | | | Grant Date Value (3) | | | | | | | | | | | | | | | Mr. Adamczyk | | | 11,600 | | | $ | 2,098,672 | | | | | Mr. Lewis | | | 3,500 | | | $ | 633,220 | | | | | Ms. Madden | | | 3,500 | | | $ | 633,220 | | | | | Mr. Gautam | | | 3,400 | | | $ | 615,128 | | | | | Mr. Waldron | | | 2,900 | | | $ | 524,668 | |
(1) | All officer RSUs awarded on February 14, 2020.
|
(2) | Officer RSUs vest 33%, 33%, 34% on the second, fourth, and sixth anniversaries of the grant date, respectively. During the vesting period, dividend equivalents will be earned in the form of additional RSU shares based on regular dividends paid by Honeywell, with such additional dividends vesting on the same timing as the underlying RSUs to which they relate. In addition, upon vesting, the NEO must hold the resulting net gain shares for at least one year before being eligible to sell the shares.
|
(3) | Based on a grant date value $180.92 determined using the average of the high and low stock prices of Honeywell stock on the grant date.
|
| | | | | | | | | | | | | NEO | # of RSUs (1)(2) | Grant Date Value (3) | | Mr. Adamczyk | 11,000 | | | $ | 2,229,920 | | | Mr. Lewis | 3,400 | | | $ | 689,248 | | | Ms. Madden | 3,400 | | | $ | 689,248 | | | Ms. Dallara | 2,800 | | | $ | 567,616 | | | Mr. Madsen | 2,300 | | | $ | 466,256 | |
(1)All officer RSUs awarded on February 12, 2021. (2)Officer RSUs vest 33%, 33%, 34% on the second, fourth, and sixth anniversaries of the grant date, respectively. During the vesting period, dividend equivalents will be earned in the form of additional RSU shares based on regular dividends paid by Honeywell, with such additional dividends vesting on the same timing as the underlying RSUs to which they relate. In addition, upon vesting, RSUs are settled in shares of Honeywell stock with the NEO required to hold the resulting net shares at least one year before being able to sell them. (3)Based on a grant date value of $202.72, determined using the average of the high and low stock prices of Honeywell stock on the grant date. OTHER COMPENSATION AND BENEFIT PROGRAMS I
We offer various retirement benefits to our NEOs. Specifically, depending upon when and where they joined the Company, some NEOs may participate in broad-based plans, including a defined benefit pension plan and a 401(k) savings plan that provides matching Company contributions. We also maintain an unfunded supplemental retirement plan to replace the portion of an executive’s pension benefit that cannot be paid under the broad-based plans because of Internal Revenue Service (IRS) limitations. More information on retirement benefits can be found beginning on page 76.I84.
NONQUALIFIED DEFERRED COMPENSATION PLANS Executive officers
Honeywell executives (including the NEOs) may choose to participate in certain nonqualified deferred compensation plans to permit retirement savings in a tax-efficient manner. Executive officersExecutives can elect to defer up to 100% of their annual ICP awards. In addition, executive officersexecutives may also participate in the Honeywell Supplemental Savings Plan to defer base salary that cannot be contributed to the Company’s 401(k) savings plan due to IRS limitations. These amounts are matched by the Company only to the extent required to make up for a shortfall in the available match under the 401(k) savings plan due to IRS limitations. Deferred compensation balances earn interest at a fixed rate based on the Company’s 15-year cost of borrowing, which is subject to change on an annual basis. Consistent with the long-term focus of the executive compensation program, matchingbasis (1.74% for 2021). Matching contributions are treated as if invested in Company common stock. These plans are explained in more detail beginning on page 78.I87.
Our NEOs are entitled to participate in Honeywell-wide benefits such as life, medical, dental, and accidental death and disability insurance that are competitive with other similarly sized companies. The NEOs participate in these programs on the same basis as the rest of our salaried employees. We also maintain low-cost excess liability coverage for all executive-level personnel, including the NEOs. The NEOs are also eligible for an annual executive physical, and Charlotte-based officers participate in a low-cost regional concierge medical service program which was first introduced in 2020.program. Our security policy requires that our Chairman and CEO use Honeywell aircraft for all air travel (business or personal) to ensure personal security and protect the confidentiality of our business. From time to time, we also permit other executive officers to use Honeywell aircraft for personal or business use. The security plan for the Chairman and CEO also provides for home security and related monitoring. | | | | | | | | | 65
74 | |
| | | |Notice and Proxy Statement | 2021
| | | 2022 |
COMPENSATION DISCUSSION AND ANALYSIS
| | | 06 | | | COMPENSATION DISCUSSION
AND ANALYSIS
|
COMPENSATION PRACTICES AND POLICIES
| | | | | | | | | | | | | | | | | | | | | I WHAT WE DO | | | | I WHAT WE DON’T DO | | | | | | | | | | | | | | | 
| | Pay for Performance. We closely align pay and performance, with a significant portion of target total direct compensation at-risk. The MDCC validates this alignment annually and ensures performance-based compensation represents a significant portion of executive compensation.
| | | | 
| | No Excessive Perks. We do not provide perquisites except in cases where there is a compelling business or security reason, nor do we provide tax gross-ups for officers, other than in connection with a Company-required relocation. | | | | | | | | | | | | | | |
| | Robust Performance Goals. We establish clear and measurable goals and targets and hold our executives accountable for achieving specified levels to earn a payout under our incentive plans. We use different sets of operational metrics for ICP and performance-based LTI to drive top and bottom-line growth over multiple time frames, aligned with our goal of sustained long-term performance.
| | | |
| | No Guaranteed Annual Salary Increases or Bonuses. Annual salary increases are based on evaluations of individual performance and the competitive market. In addition, we do not provide guarantees on bonus payouts. | | | | | | | | | | | | | | |
| | Clawback Practices. We maintain a policy that allows for recoupment of incentive compensation for a significant financial restatement or if an executive leaves the Company to join a competitor.
| | | |
| | No Hedging or Pledging. We do not allow hedging or pledging of our stock. | | | | | | | | | | | | | | |
| | Double Trigger in the Event of a Change-in-Control (CIC). We have double trigger vesting on equity and severance for CIC; executives will not receive cash severance nor will equity vest in the event of a CIC unless accompanied by qualifying termination of employment. | | | |
| | No Excise Tax Gross-Ups and No Accelerated Bonus Payments Upon CIC. Excise tax gross-ups have been eliminated for all executive officers. Plans provide that ICP awards earned in the year of a CIC would be paid at the time they would typically be paid based on business performance rather than target.
| | | | | | | | | | | | | | |
| | Maximum Payout Caps for Incentive Plans. Annual cash incentive plan (ICP) and Performance Plan payouts are capped. | | | |
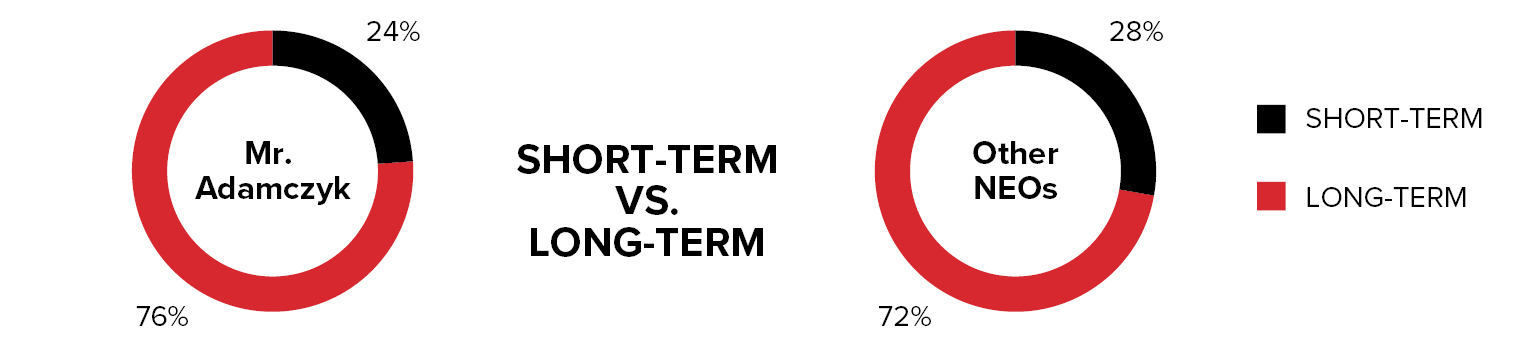
| | No Incentivizing of Short-Term Results to the Detriment of Long-Term Goals and Results. Pay mix is heavily weighted toward long-term incentives aligned with the interests of shareowners.
| | | | | | | | | | | | | | |
| | Robust Stock Ownership Requirements. We require executive officers to hold meaningful amounts of stock and require them to hold net shares for one year from exercise or vesting.
| | | |
| | No Excessive Risks. Compensation practices are appropriately structured and avoid incentivizing employees to engage in excessive risk-taking. | | | | | | | | | | | | | | |
| | Options Granted at FMV. Annual stock options awarded to all executives (including the NEOs) are approved by the MDCC on the same day, with an exercise price no less than the fair market value of Honeywell’s common stock on the date of grant.
| | | |
| | No Options Repricing. We prohibit repricing (reduction in exercise price or exchange for cash or other consideration) or reloading of stock options. | | | | | | | | | | | | | | |
| | Independent Compensation Consultant. The MDCC retains an independent compensation consultant to review and advise the MDCC on executive compensation matters. The independent consultant attends all MDCC meetings.
| | | |
| | No Consultant Conflicts. Under the MDCC’s established policy, the compensation consultant cannot provide any other services to Honeywell without the MDCC’s approval. Regular independence reviews are conducted. | | | | | | | | | |
| | | | |
| | | Notice and Proxy Statement | 2021
| | 66
|
| | | 06 | | | COMPENSATION DISCUSSION
AND ANALYSIS
|
RISK OVERSIGHT CONSIDERATIONS The MDCC believes that balancing the various elements of Honeywell’s executive compensation program: •Supports the achievement of competitive sales, earnings, and cash performance in variable economic and industry conditions without undue risk; and •Mitigates the potential to reward risk-taking that may produce short-term results that appear in isolation to be favorable, but that may undermine the successful execution of the Company’s long-term business strategy and adversely impact shareowner value. The following compensation design features guard against unnecessary or excessive risk-taking: Robust processes for developing strategic and annual operating plans, approval of capital investments, internal controls over financial reporting, and other financial, operational, and compliance policies and practices.
Diversity of the Company’s overall portfolio of businesses with respect to industries and markets served (types, long-cycle / short-cycle), products and services sold, and geographic footprint.
MDCC review and approval of corporate, business, and individual executive officer objectives to ensure that these goals are aligned with the Company’s annual operating and strategic plans, achieve the proper risk/reward balance, and do not encourage unnecessary or excessive risk-taking.
| | | Robust processesfor developing strategic and annual operating plans, approval of capital investments, internal controls over financial reporting, and other financial, operational, and compliance policies and practices. | Diversity of the Company’s overall portfolioof businesses with respect to industries and markets served (types, long-cycle/short-cycle), products and services sold, and geographic footprint. | MDCC review and approvalof corporate, business, and individual executive officer objectives to ensure that these goals are aligned with the Company’s annual operating and strategic plans, achieve the proper risk/reward balance, and do not encourage unnecessary or excessive risk-taking. |
Executive Compensationcompensation features that guard against unnecessary or excessive risk-taking include: •Pay mix between fixed and variable, annual and long-term, and cash and equity compensation is designed to encourage strategies and actions that are in the Company’s long-term best interests; interests•Base salaries are positioned to be consistent with executives’ responsibilities, so they are not motivated to take excessive risks to achieve financial security; security.•Incentive awards are determined based on a review of a variety of performance indicators, diversifying the risk associated with any single performance indicator; indicator.•Design of long-term compensation program rewards executives for driving sustainable, profitable growth for shareowners; shareowners.•Vesting periods for equity compensation awards encourage executives to focus on sustained stock price appreciation; and appreciation.•Incentive plans are not overly leveraged, have maximum payout caps, and have design features that are intended to balance pay for performance with an appropriate level of risk-taking. •The MDCC also has someretains discretionary authority (e.g., 20% of awards) to adjust the annual ICP payments, which further reduces the potential for negative business risk associated with such plans. Adoption of clawback policies, which provide for the recoupment of incentive compensation paid to senior executives if there is a significant restatement of Company financial results. Clawback provisions in the Company’s current stock plan also allow the Company to cancel sharesexclude unusual or recover gains realized by an executive if non-competition or non-solicitation provisions are violated.
Prohibition on hedging and pledging of shares by executive officers and directors.
Ownership thresholds in the Company’s stock ownership guidelines for officers that require NEOs to hold shares of common stock equal to four times their current annual base salary (six times for the CEO), as detailed in the Stock Ownership Guidelines.
Officers must also hold 100% of the net shares from vesting of RSUs, the net shares issued from PSUs,infrequently occurring items, extraordinary items, and the net gain shares from option exercises for at least one year.
cumulative effect of changes in accounting treatment when determining performance attainment under formulaic plans where events and/or business conditions warrant. | | | Clawback policieswhich provide the ability to recoup performance-based incentive awards (both equity and cash-based awards) in the event of misconduct and a restatement of Company financial results. In addition, clawback provisions in the Company’s stock plan and short-term incentive plan allow the Company to cancel shares or recover gains, or payments made, if an executive violates non-competition or non-solicitation provisions. | Prohibition on hedging and pledging of sharesby executive officers and directors. | Ownership thresholdsin the Company’s stock ownership guidelines for officers that require NEOs to hold shares of common stock equal to four times their current annual base salary (six times for the CEO), as detailed in the Stock Ownership Guidelines. | Holding periods in the Company's stock ownership guidelinesrequire that officers must hold 100% of the net shares from vesting of RSUs, the net shares issued from PSUs, and the net gain shares from option exercises for at least one year. |
Based upon the MDCC’s risk oversight and compensation policies, the risks arising from the Company’s compensation policies and practices are not reasonably likely to have a material adverse effect on Honeywell’s operations or results. A full discussion of the role of the Board in the risk oversight process begins on page 2337 of this Proxy Statement. | | | | | | | | | 67
| |
| | | | Notice and Proxy Statement | 2021
| | | |
| | | 06 | | | COMPENSATION DISCUSSION
AND ANALYSIS
|
ISTOCK OWNERSHIP GUIDELINES
The MDCC believes that Honeywell executives more effectively pursue shareowners’ long-term interests if they hold substantial amounts of stock. Accordingly, the MDCC maintains minimum stock ownership guidelines for all executive officers. Under these guidelines, the Chairman and CEO must hold shares of common stock equal in value to six times his current annual base salary. Other executive officers are required to own shares equal in value to four times their current base salary. Shares used in determining whether these guidelines are met include shares held personally, equivalent shares held in qualified and nonqualified retirement accounts, outstanding RSUs, and 50% of outstanding PSUs. All NEOs maintain ownership levels well above these minimum requirements, as shown in the following table. Named Executive Officers’ Stock Ownership
| | | | | | | | | | | | | Notice and Proxy Statement | 2022 | | 75 |
COMPENSATION DISCUSSION AND ANALYSIS NAMED EXECUTIVE OFFICERS’ STOCK OWNERSHIP | | | | | | | | | | | | | Mr. Adamczyk | | | Other NEOs (Average) | | | | | | | | | | | | | | | | | At37xand 19xbase pay, the value of our Chairman and CEO and our Other NEOs’ shareholdings substantially exceed requirements | | | High levels of stock ownership reflectlong-term focus and commitmentof the Honeywell executive team |
Represents stock ownership as of MarchFebruary 15, 2021.2022. In addition, the stock ownership guidelines require officers to hold for at least one year 100% of the “net shares” obtained from RSUs that vest, the “net shares” issued from PSUs, and the “net gain shares” obtained from the exercise of stock options. “Net shares” means the number of shares issued when RSUs vest or PSUs are earned, less the number of shares withheld or sold to pay applicable taxes. “Net gain shares” means the number of shares obtained from exercising stock options, less the number of shares needed to cover the option exercise price and applicable taxes. After the one-year holding period, officers may sell net shares or net gain shares; however, after the sale, they must continue to meet the prescribed minimum stock ownership guideline level. I
Our Corporate Governance Guidelines provide for the recoupment (or clawback) of incentive compensation paid to senior executives if there is a significant restatement of financial results (a Restatement). Under the guidelines, the Board can seek recoupment if and to the extent that: •The amount of incentive compensation was calculated based upon the achievement of financial results that were subsequently reduced due to a Restatement; •The senior executive engaged in misconduct; and •The amount of incentive compensation that would have been awarded to the senior executive had the financial results been properly reported would have been lower than the amount actually awarded. The complete text of the Corporate Governance Guidelines is posted on our website at investor.honeywell.com (see “Corporate Governance/“Governance/Governance Guidelines”Overview”). In addition, if during the two-year period following an executive officer’s termination of employment with Honeywell, he or she commences employment with, or otherwise provides services to a Honeywell competitor, without the MDCC’s prior approval, or violates non-solicitation commitments, then the Company reserves the right, for awards issued under its Stock Incentive Plans, to: •Cancel all unexercised options; and •Recover any gains attributable to options that were exercised, and any value attributable to RSUs and Performance Plan awards that were paid, during the period beginning 12 months before and ending two years after the executive officer’s termination of employment. | | | | |
| | | Notice and Proxy Statement | 2021
| | 68
|
| | | 06 | | | COMPENSATION DISCUSSION
AND ANALYSIS
|
Honeywell has entered into non-competition agreements with each of the NEOs that preclude them from going to work for a competitor for up to two years after termination of employment. The list of competitors and the duration of the non-competition covenant has been tailored, in each case, to the executive officer’s position and the competitive threat this represents. Because money damages cannot adequately compensate Honeywell for violations of these non-competition covenants, we have a full range of equitable remedies at our disposal to enforce these agreements, including the ability to seek injunctive relief. I
| | | | | | | | | | 76 | | Notice and Proxy Statement | 2022 |
COMPENSATION DISCUSSION AND ANALYSIS TAX DEDUCTIBILITY OF EXECUTIVE COMPENSATION Beginning in 2018, Section 162(m) of the Internal Revenue Code limits the federal income tax deduction for annual individual compensation to $1 million for the NEOs,Company’s “covered employees” without any exception for performance-based compensation, subject to a transition rule for certain written binding contracts in effect on November 2, 2017, and not materially modified after that date. The Company intends to comply with the transition rule for written binding contracts in effect on November 2, 2017, to the extent applicable, so long as the MDCC determines that to be in the Company’s best interest. As discussed above under Compensation Practices and Policies, the MDCC seeks to closely align executive pay with performance, even if there is no longer a “performance-based” provision under Section 162(m) , and, in any case, the MDCC reserves the ability to structure compensation arrangements to provide appropriate compensation to the Company’s executives, even where such compensation is not deductible under Section 162(m). I
PLEDGING AND HEDGING TRANSACTIONS IN COMPANY SECURITIES Executive officers, directors, and any of their respective designees are prohibited from pledging Honeywell’s securities or using Honeywell’s securities to support margin debt. All other employees must exercise extreme caution in pledging Honeywell’s securities or using Honeywell’s securities to support margin debt. Hedging by directors, executive officers, employees on our restricted trading list, any employee in possession of material non-public information, or any of their designees is prohibited, and it is strongly discouraged for all other employees. For this purpose, hedging means purchasing financial instruments (including prepaid variable forward sale contracts, equity swaps, collars, and interests in exchange funds) or otherwise engaging in transactions that are designed to hedge or offset any decrease in the market value of Company stock held, directly or indirectly, by them, whether the stock was acquired as part of a compensation arrangement or otherwise. All employees, directors, and any of their respective designees are prohibited from engaging in short sales of Honeywell securities. Selling or purchasing puts or calls or otherwise trading in or writing options on Honeywell’s securities by employees, officers, and directors is also prohibited.
MANAGEMENT DEVELOPMENT AND COMPENSATION COMMITTEE REPORT The MDCC reviewed and discussed Honeywell’s Compensation Discussion and Analysis with management. Based on this review and discussion, the MDCC recommended thatto the Board of Directors includethat the Compensation Discussion and Analysis be included in this Proxy Statement and incorporated by reference in the Form 10-K for the year ended December 31, 2020.2021. The Management Development and Compensation Committee D. Scott Davis (ex officio member) member ) | | | | | | | | | | | | | Notice and Proxy Statement | 2022 | | 77 |
EXECUTIVE COMPENSATION TABLES SUMMARY COMPENSATION TABLE | | | | | | | | | | | | | | | | | | | | | | | | | | | | | | | | | | | | | | | | | | | | | | | | | | | | | | | | | Named
Executive
Officer | Year | Salary | Stock Awards(2) | Option Awards(3) | Non-Equity Incentive Plan Compensation(4) | Change In Pension Value and Nonqualified Deferred Compensation Earnings(5) | All Other Compensation(6) | SEC Total Compensation(7) | | Non-SEC Total Annual Direct Compensation(8) | Darius Adamczyk Chairman and Chief Executive Officer | 2021 | | $ | 1,675,616 | | | $ | 14,486,389 | | | $ | 5,248,350 | | | $ | 3,910,000 | | | $ | 608,232 | | | $ | 171,533 | | | $26,100,120 | | | | $ | 20,566,195 | | | 2020 | | $ | 1,566,154 | | | $ | 9,113,476 | | | $ | 4,898,608 | | | $ | 2,508,000 | | | $ | 810,840 | | | $ | 178,203 | | | $19,075,281 | | | | $ | 18,086,238 | | | 2019 | | $ | 1,600,000 | | | $ | 8,612,506 | | | $ | 4,635,409 | | | $ | 4,065,000 | | | $ | 748,107 | | | $ | 864,082 | | | $20,525,104 | | | | $ | 18,912,915 | | Gregory P. Lewis Senior Vice President, Chief Financial Officer | 2021 | | $ | 830,493 | | | $ | 4,518,031 | | | $ | 1,643,520 | | | $ | 1,107,000 | | | $ | 215,089 | | | $ | 65,570 | | | $8,379,703 | | | | $ | 6,629,344 | | | 2020 | | $ | 753,711 | | | $ | 2,801,775 | | | $ | 1,502,982 | | | $ | 1,460,750 | | | $ | 254,487 | | | $ | 57,627 | | | $6,831,332 | | | | $ | 5,747,468 | | | 2019 | | $ | 749,808 | | | $ | 2,288,198 | | | $ | 1,222,904 | | | $ | 1,866,600 | | | $ | 185,939 | | | $ | 331,184 | | | $6,644,633 | | | | $ | 5,316,910 | | Anne T. Madden Senior Vice President, General Counsel | 2021 | | $ | 869,458 | | | $ | 4,518,031 | | | $ | 1,643,520 | | | $ | 1,159,000 | | | $ | 389,020 | | | $ | 80,362 | | | $8,659,391 | | | | $ | 6,720,309 | | | 2020 | | $ | 825,529 | | | $ | 2,801,775 | | | $ | 1,502,982 | | | $ | 758,000 | | | $ | 459,798 | | | $ | 87,544 | | | $6,435,628 | | | | $ | 5,888,286 | | | 2019 | | $ | 757,019 | | | $ | 2,288,198 | | | $ | 1,222,904 | | | $ | 1,970,500 | | | $ | 399,898 | | | $ | 69,977 | | | $6,708,496 | | | | $ | 5,370,121 | | Que Thanh Dallara(1) President and Chief Executive Officer, Honeywell Connected Enterprise | 2021 | | $ | 676,466 | | | $ | 3,860,000 | | | $ | 1,364,250 | | | $ | 804,000 | | | $ | 773 | | | $ | 52,160 | | | $6,757,649 | | | | $ | 5,367,608 | | | | | | | | | | | | | | | | | | | | Michael R. Madsen(1) President and Chief Executive Officer, Aerospace | 2021 | | $ | 737,052 | | | $ | 2,937,572 | | | $ | 1,094,610 | | | $ | 1,338,000 | | | $ | 726 | | | $ | 53,362 | | | $6,161,322 | | | | $ | 4,697,640 | | | | | | | | | | | | | | | | | | | |
(1)Ms. Dallara and Mr. Madsen are being reported as NEOs for the first time in 2022 (2021 compensation). (2)2021 Stock Awards represent the sum of three components (i) the annual PSU awards under the 2021-2023 Performance Plan at a fair value of $212.53 as of the grant date (March 15, 2021), (ii) the annual RSUs awarded at a grant date fair value of $202.72, determined using the average of the high and low stock prices of Honeywell stock on the grant date (February 12, 2021), and (iii) the incremental fair value from a pandemic-related modification to the financial metrics for the 2020-2022 PSU awards, which was made on March 15, 2021 (described on page 69 of this proxy statement). The 2021-2023 PSU award value was calculated based on the weighted average of (a) the fair market value of Honeywell stock on the date of grant for the 75% of the award tied to performance against internal metrics, and (b) a multifactor Monte Carlo simulation of Honeywell’s stock price and TSR relative to each of the other companies in the Compensation Peer Group, determined in accordance with FASB ASC Topic 718, for the 25% of the award with payout determined based on three-year TSR relative to the Compensation Peer Group. The value of the 2020-2022 PSU modification represents the incremental fair value of 2020-2022 PSUs originally granted in 2020, determined as of the March 15, 2021 modification date in accordance with FASB ASC Topic 718 for a Type III modification, with no offset for the forfeiture of the portion of the original award that became improbable of attainment due to the impacts from the COVID-19 pandemic. | | | | | | | | | | | | | | | | | | | | | | | | | | | | NEO | 2021-2023
Performance Stock Units | Restricted Stock
Units | 2020-2022
Performance Stock Unit Modification | Total SEC Reportable Stock Awards | | Mr. Adamczyk | | $ | 7,502,309 | | | $ | 2,229,920 | | | $ | 4,754,160 | | | $ | 14,486,389 | | | Mr. Lewis | | $ | 2,359,083 | | | $ | 689,248 | | | $ | 1,469,700 | | | $ | 4,518,031 | | | Ms. Madden | | $ | 2,359,083 | | | $ | 689,248 | | | $ | 1,469,700 | | | $ | 4,518,031 | | | Ms. Dallara | | $ | 1,955,276 | | | $ | 567,616 | | | $ | 1,337,108 | | | $ | 3,860,000 | | | Mr. Madsen | | $ | 1,572,722 | | | $ | 466,256 | | | $ | 898,594 | | | $ | 2,937,572 | |
(3)The 2021 Option Awards shown reflect the aggregate grant date fair value of the awards computed in accordance with FASB ASC Topic 718, using the Black-Scholes option-pricing model at the time of grant, with the expected-term input derived from a risk-adjusted Monte Carlo simulation of the historical exercise behavior and probability-weighted movements in Honeywell’s stock price over time. The 2021 annual Option Awards were awarded on February 12, 2021, with a Black-Scholes value of $32.10 per share at the time of grant. A discussion of the assumptions used in the valuation of option awards made in fiscal year 2021 may be found in Note 15 of the Notes to the Financial Statements in the Company’s Form 10-K for the year ended December 31, 2021. | | | | | | | | | 69
78 | |
| | | |Notice and Proxy Statement | 2021
| | | 2022 |
| | | 07 | | | EXECUTIVE
COMPENSATION TABLES
|
EXECUTIVE COMPENSATION TABLES
(4)SUMMARY COMPENSATION TABLE
| | | | | | | | | | | | | | | | | | | | | | | | | | | | | | | | | | | | | | | | | | | | | | | | | | | | | | | | | | | | | | | | | | | | | | | | | | | | | | | | | | | | | | | | | | | Named Executive Officer | | Year | | | Salary(2) | | | Stock Awards(3) | | | Option Awards(4) | | | Non-Equity Incentive Plan Compensation(5) | | | Change In Pension Value and Nonqualified Deferred Compensation Earnings(6) | | | All Other Compensation(7) | | | SEC Total Compensation(8) | | | | | | | | | Non-SEC Total Annual Direct Compensation(9) | | | | | | | | | | | | | | | | | | | | | | | | | | | | | | | | | | | | | | | | | | | | | | | | Darius Adamczyk Chairman and Chief Executive Officer | | | 2020 | | | $ | 1,566,154 | | | $ | 9,113,476 | | | $ | 4,898,608 | | | | $2,508,000 | | | | $810,840 | | | | $178,203 | | | | $19,075,281 | | | | | | | | | | | | $18,086,238 | | | | | 2019 | | | $ | 1,600,000 | | | $ | 8,612,506 | | | $ | 4,635,409 | | | | $4,065,000 | | | | $748,107 | | | | $864,082 | | | | $20,525,104 | | | | | | | | | | | | $18,912,915 | | | | | 2018 | | | $ | 1,571,154 | | | $ | 9,561,215 | | | $ | 3,185,655 | | | | $4,100,000 | | | | $595,082 | | | | $233,498 | | | | $19,246,604 | | | | | | | | | | | | $18,418,024 | | Gregory P. Lewis
Senior Vice President,
Chief Financial Officer | | | 2020 | | | $ | 753,711 | | | $ | 2,801,775 | | | $ | 1,502,982 | | | | $1,460,750 | | | | $254,487 | | | | $ 57,627 | | | | $ 6,831,332 | | | | | | | | | | | | $ 5,747,468 | | | | | 2019 | | | $ | 749,808 | | | $ | 2,288,198 | | | $ | 1,222,904 | | | | $1,866,600 | | | | $185,939 | | | | $331,184 | | | | $ 6,644,633 | | | | | | | | | | | | $ 5,316,910 | | | | | 2018 | | | $ | 578,981 | | | $ | 554,742 | | | $ | 591,250 | | | | $ 730,000 | | | | $103,155 | | | | $ 48,365 | | | | $ 2,606,493 | | | | | | | | | | | | $ 2,979,973 | | Anne T. Madden(1) Senior Vice President, General Counsel | | | 2020 | | | $ | 825,529 | | | $ | 2,801,775 | | | $ | 1,502,982 | | | | $ 758,000 | | | | $459,798 | | | | $ 87,544 | | | | $ 6,435,628 | | | | | | | | | | | | $ 5,888,286 | | | | | 2019 | | | $ | 757,019 | | | $ | 2,288,198 | | | $ | 1,222,904 | | | | $1,970,500 | | | | $399,898 | | | | $ 69,977 | | | | $ 6,708,496 | | | | | | | | | | | | $ 5,370,121 | | | | | | | | | | | | | | | | | | | | | | | | | | | | | | | | | | | | | | | | | | | | | | | Rajeev Gautam(1) President and Chief Executive Officer Performance Materials and Technologies | | | 2020 | | | $ | 768,394 | | | $ | 2,727,112 | | | $ | 1,468,726 | | | | $ 503,000 | | | | $403,986 | | | | $ 56,523 | | | | $ 5,927,741 | | | | | | | | | | | | $ 5,467,232 | | | | | 2019 | | | $ | 779,231 | | | $ | 2,621,868 | | | $ | 1,412,368 | | | | $ 976,000 | | | | $685,839 | | | | $ 55,857 | | | | $ 6,531,163 | | | | | | | | | | | | $ 5,789,467 | | | | | 2018 | | | $ | 755,247 | | | $ | 2,940,717 | | | $ | 979,110 | | | | $ 900,000 | | | | $ 6,799 | | | | $ 51,790 | | | | $ 5,633,663 | | | | | | | | | | | | $ 5,575,074 | | | | | | | | | | | | | | | | | | | | | | | | | | | | | | | | | | | | | | | | | | | | | | | John F. Waldron(1) President and Chief Executive Officer Safety and Productivity Solutions | | | 2020 | | | $ | 704,769 | | | $ | 2,278,369 | | | $ | 1,224,652 | | | | $ 908,000 | | | | $190,879 | | | | $ 54,508 | | | | $ 5,361,177 | | | | | | | | | | | | $ 5,115,790 | | | | | | | | | | | | | | | | | | | | | | | | | | | | | | | | | | | | | | | | | | | | | | |
(1) | Ms. Madden was not a NEO for the 2018 compensation year (2019 Proxy). Mr. Waldron is being reported as a NEO for the first time in 2021 (2020 compensation). Mr. Gautam has three years of compensation reported even though he was not a NEO in the 2019 Proxy statement (2018 compensation), as he was previously a NEO in the 2018 annual Proxy statement (2017 compensation).
|
(2) | Salary for 2020 reflects the impact of temporary reduction in base salary as a result of the COVID-19 pandemic. Includes one additional bi-weekly pay period due to payroll calendar.
|
(3) | 2020 Stock Awards represent the sum of (i) PSU awards under the 2020-2022 Performance Plan at a grant date fair value of $188.57 and (ii) RSUs awarded at a grant date value of $180.92, determined using the average of the high and low stock prices of Honeywell stock on the grant date. All 2020 Stock Awards were granted on February 14, 2020. The PSU award value was calculated based on the weighted average of (a) the fair market value of Honeywell stock on the date of grant for the 75% of the award tied to performance against internal metrics, and (b) a multifactor Monte Carlo simulation of Honeywell’s stock price and TSR relative to each of the other companies in the Compensation Peer Group, determined in accordance with FASB ASC Topic 718, for the 25% of the award with payout determined based on three-year TSR relative to the Compensation Peer Group.
|
| | | | | | | | | | | | | | | | | | | | | | | | | | | | | | | | | | | | | | | | | | | | | | | | | | | | | | | | | | | | | | | | | | | | | | | | | | | | | | | | | | | | | | | | | | | | | | | | | | | | | | | | | | | | | | | | | | | | | | | | | | | | | | | | | | | | | | | | | | | | | | | | | | | | | | | | | | | NEO | | 2020-2022 Performance Stock Units | | | Restricted Stock Units | | | Total Stock Awards | | | | | | | | | | | | | | | | | | | | | | | | | | | | | | | | | | | | | | | | | | | | | | | | | | | | | | | | | | | | | | | | | | | | | | | | | | | | | | | | | | | | | | | | | | | | | | | | | | | | | | | | | | | | | | | | | | | | | | | | | | | | | | | | | | | | | | | | | | | | | Mr. Adamczyk | | | $7,014,804 | | | | $2,098,672 | | | | $9,113,476 | | | | | | | | | | | | | | | | | | | | | | | | | | | | | | | | | | | | | | | | | | | | | | | | | | | | | | | | | | | | | | | | | | Mr. Lewis | | | $2,168,555 | | | | $ 633,220 | | | | $2,801,775 | | | | | | | | | | | | | | | | | | | | | | | | | | | | | | | | | | | | | | | | | | | | | | | | | | | | | | | | | | | | | | | | | | Ms. Madden | | | $2,168,555 | | | | $ 633,220 | | | | $2,801,775 | | | | | | | | | | | | | | | | | | | | | | | | | | | | | | | | | | | | | | | | | | | | | | | | | | | | | | | | | | | | | | | | | | Mr. Gautam | | | $2,111,984 | | | | $ 615,128 | | | | $2,727,112 | | | | | | | | | | | | | | | | | | | | | | | | | | | | | | | | | | | | | | | | | | | | | | | | | | | | | | | | | | | | | | | | | | Mr. Waldron | | | $1,753,701 | | | | $ 524,668 | | | | $2,278,369 | | | | | | | | | | | | | | | | | | | | | | | | | | | | | | | | | | | | | | | | | | | | | | | | | | | | | | | | | | | | | | | | | |
The 2020-2022 PSU2021 Non-Equity Incentive Plan Compensation value for each NEO, except Mr. Madsen, represents their annual ICP award values reflect the original grant date values. The subsequent pandemic-related adjustment to the plan financial metrics for the 2020-2022 PSUs,2021 plan year. 80% of the ICP award is determined using the pre-set formulaic methodology discussed beginning on page 60, and the remaining 20% is based on individual assessments determined by the MDCC discussed beginning on page 62. The amount for Mr. Madsen includes the sum of both his 2021 annual ICP award and his earned payout from Performance Plan cash units issued for the January 1, 2019 – December 31, 2021 cycle, that is required to be reported in the final year of the performance period under SEC rules, even though granted in 2019 and covering a three-year period. The following table provides the breakdown of the amounts reported as 2021 Non-Equity Incentive Plan Compensation for Mr. Madsen: | | | | | | | | | | | | | NEO | 2021 ICP Award | 2019-2021 Performance Plan Cash Award | Total Non-Equity Incentive Plan Compensation | | Mr. Madsen | $827,000 | | $511,000 | | $1,338,000 | |
(5)Represents (i) the aggregate change in the present value of each Named Executive Officer’s accumulated benefit under the Company’s pension plans from December 31, 2020 to December 31, 2021 (as disclosed in the Pension Benefits table on page 84 of this Proxy Statement) and (ii) interest earned in 2021 on deferred compensation that is considered “above-market interest” under SEC rules (as discussed on page 87). | | | | | | | | | | | | | | | | | | | | | | NEO | Change in Pension Value(a) | NQDC Interest(b) | Total Change in Pension
Value and Nonqualified
Deferred Compensation
Earnings | | Mr. Adamczyk | | $ | 605,743 | | | $ | 2,489 | | | $ | 608,232 | | | Mr. Lewis | | $ | 214,342 | | | $ | 747 | | | $ | 215,089 | | | Ms. Madden | | $ | 331,513 | | | $ | 57,507 | | | $ | 389,020 | | | Ms. Dallara | | $ | — | | | $ | 773 | | | $ | 773 | | | Mr. Madsen | | $ | — | | | $ | 726 | | | $ | 726 | |
(a)The change in aggregate pension value for Mr. Madsen was negative in 2021 ($8,126) resulting primarily from an increase in the discount rate from 2.50% as of December 31, 2020, to 2.87% at December 31, 2021. Under SEC rules, negative changes in pension values are not reported on the table. The value of benefits for the other NEOs, other than Ms. Dallara, was calculated as the lump sum under their pension formula as of December 31, 2021, which is unaffected by interest rates. Ms. Dallara is not eligible for a company sponsored pension plan. (b)Represents earnings under the Honeywell Excess Benefit Plan, Honeywell Supplemental Savings Plan, Honeywell Deferred Incentive Plan, or deferred RSU awards that are in excess of that determined using SEC market interest rates. (6)For 2021, All Other Compensation consists of the following: | | | | | | | | | | | | | | | | | | | | | | | | | | | | | | | | | | | | | | | | | NEO | Matching Contributions(a) | Personal Use of Company Aircraft(b) | Security(c) | Excess Liability Insurance(d) | | Executive Physical/ Medical Services (e) | Total
Other
Compensation | | Mr. Adamczyk | | $ | 117,196 | | | $ | 43,040 | | | $ | 1,332 | | | $ | 1,515 | | | | $ | 8,450 | | | $ | 171,533 | | | Mr. Lewis | | $ | 58,057 | | | $ | 498 | | | $ | — | | | $ | 1,515 | | | | $ | 5,500 | | | $ | 65,570 | | | Ms. Madden | | $ | 60,833 | | | $ | 12,514 | | | $ | — | | | $ | 1,515 | | | | $ | 5,500 | | | $ | 80,362 | | | Ms. Dallara | | $ | 47,319 | | | $ | — | | | $ | — | | | $ | 1,515 | | | | $ | 3,326 | | | $ | 52,160 | | | Mr. Madsen | | $ | 51,546 | | | $ | — | | | $ | — | | | $ | 1,515 | | | | $ | 301 | | | $ | 53,362 | |
(a)Represents total Company matching contributions to each Named Executive Officer’s accounts in the tax-qualified Honeywell 401(k) Plan and the non-tax-qualified Supplemental Savings Plan. (b)For security reasons, Mr. Adamczyk is required by Company policy to use Company aircraft for all business and personal travel (requirement to use Company aircraft for specific personal travel may be waived at the discretion of Honeywell’s security personnel). Other NEOs may have access to available corporate aircraft for personal travel, from time to time, if approved by the CEO. The amount shown for each NEO represents the aggregate incremental cost of personal travel. This amount is calculated by multiplying the total number of personal flight hours by the average direct variable operating costs (e.g., expenses for aviation employees, variable aircraft maintenance, telecommunications, transportation charges, including but not limited to hangar and landing fees, aviation fuel, and commissaries) per flight hour for Company aircraft. (c)In accordance with the CEO security plan, represents the total paid by the Company in 2021 for expenses relating to personal residential security provided to protect Mr. Adamczyk. (d)Represents the annual premiums paid by the Company to purchase excess liability insurance coverage for each Named Executive Officer. (e)Represents cost of the annual executive physical covered by the Company (excess over insurance) and concierge medical services provided to Charlotte-based officers. (7)Represents total reportable compensation determined in accordance with SEC disclosure requirements. (8)Represents non-SEC supplemental information of Total Annual Direct Compensation (TADC) from the perspective of the MDCC (as discussed in the CD&A). For all years, this column excludes the amounts reflected in the (i) Change in Pension Value and Deferred Compensation Earnings, and (ii) All Other Compensation columns of the Summary Compensation Table (SCT). For 2021, this column also excludes the 2019-2021 performance cash award to Mr. Madsen (see footnote 4), which was madeawarded in February 2021, is2019 and considered an award modification that will resultpart of TADC by the MDCC in incremental value for these awards that will2019 but required to be reflected as 2021 compensationreported on the Summary Compensation Table as 2021 compensation (at the end of the three-year performance period) under SEC rules, and the incremental reportable value from the March 2021 modification to the 2020-2022 PSUs granted to the NEOs in 2020, which the next annual Proxy Statement.(4) | The 2020 Option Awards shown reflect the aggregate grant date fair value of the awards computed in accordance with FASB ASC Topic 718, using the Black-Scholes option-pricing model at the time of grant, with the expected-term input derived from a risk-adjusted Monte Carlo simulation of the historical exercise behavior and probability-weighted movements in Honeywell’s stock price over time. The 2020 annual Option Awards were awarded on February 14, 2020, with a Black-Scholes value of $21.41 per share at the time of grant. A discussion of the assumptions used in the valuation of option awards made in fiscal year 2020 may be found in Note 16 of the Notes to the Financial Statements in the Company’s Form 10-K for the year ended December 31, 2020.
|
MDCC viewed as a pandemic-related realignment to the intended grant date value of the PSU awards reported on the Summary Compensation Table as compensation for 2020. For 2020, this column also excludes the 2018-2020 performance cash award to Mr. Lewis, which was awarded in 2018 and considered part of TADC by the MDCC in 2018 but required to be reported on the Summary Compensation Table as 2020 compensation (at the end of the three-year performance period) under SEC rules. For 2019, this column excludes the 2017-2019 performance cash awards to Mr. Lewis and Ms. Madden that were awarded in 2017 and considered part of TADC by the MDCC in 2017 but required to be reported on the Summary Compensation Table as 2019 compensation (at the end of the three-year performance period) under SEC rules. | | | | |
| | | Notice and Proxy Statement | 2021
| | 70
|
| | | 07 | | | EXECUTIVE
COMPENSATION TABLES
|
(5) | The 2020 Non-Equity Incentive Plan Compensation value for each NEO, except Mr. Lewis, represents their annual ICP award for the 2020 plan year. 80% of the ICP award is determined using the pre-set formulaic methodology discussed beginning on page 53, and the remaining 20% is based on individual assessments determined by the MDCC discussed beginning on page 55. The amount for Mr. Lewis includes both his 2020 annual ICP award and his earned payout from cash-units issued for the January 1, 2018 – December 31, 2020 cycle of the Performance Plan, that is required to be reported in the final year of the performance period under SEC rules, even though granted in 2018 and covering a three-year period. The following table provides the breakdown of the amounts reported as 2020 Non-Equity Incentive Plan Compensation for Mr. Lewis:
|
| | | | | | | | | | | | | | | | | | | | | | | | | | | | | | | | | | | | | | | | | | | | | | | | | | | | | | | | | | | | | | | | | | | | | | | | | | | | | | | | | | | | | | | | | | | | | | | | | | | | | | | | | | | | | | | | | | | | | | | | | | | | | | | | | | | | | | | | | | | | | | | | | | | | | | | | | | | | | | | | | | | | | | | | | | | | | | | | | | | | | | | | | | | | | | | | | | | | | | | | | | | | | | | | | | | | | | | NEO | | 2020 ICP
Award | | | 2018-2020
Performance
Plan Cash
Award | | | Total
Non-Equity
Incentive Plan
Compensation | | | | | | | | | | | | | | | | | | | | | | | | | | | | | | | | | | | | | | | | | | | | | | | | | | | | | | | | | | | | | | | | | | | | | | | | | | | | | | | | | | | | | | | | | | | | | | | | | | | | | | | | | | | | | | | | | | | | | | | | | | | | | | | | | | | | | | | | | | | | | | | | | | | | | | | | | | | | | | | | | | | | | | | | | | | | | | | | | | | | | | | | | | | | | | | | | | | | | | | | | | | | Mr. Lewis | | | $689,000 | | | | $771,750 | | | | $1,460,750 | | | | | | | | | | | | | | | | | | | | | | | | | | | | | | | | | | | | | | | | | | | | | | | | | | | | | | | | | | | | | | | | | | | | | | | | | | | | | | | | | | | | | | | | | | | | | | | |
(6) | Represents (i) the aggregate change in the present value of each Named Executive Officer’s accumulated benefit under the Company’s pension plans from December 31, 2019, to December 31, 2020 (as disclosed in the Pension Benefits table on page 76 of this Proxy Statement) and (ii) interest earned in 2020 on deferred compensation that is considered “above-market interest” under SEC rules (as discussed on page 79).
|
| | | | | | | | | | | | | | | | | | | | | | | | | | | | | | | | | | | | | | | | | | | | | | | | | | | | | | | | | | | | | | | | | | | | | | | | | | | | | | | | | | | | | | | | | | | | | | | | | | | | | | | | | | | | | | | | | | | | | | | | | | | | | | | | | | | | | | | | | | | | | | | | | | | | | | | | | | | | | | | | | | | | | | | | | | | | | | | | | | | | | | | | | | | | | | | | | | | | | | | | | | | | | | | | | | | | | | | NEO | | Change in Pension Value(a) | | | NQDC Interest(c) | | | Total Change in Pension Value and Nonqualified Deferred
Compensation Earnings | | | | | | | | | | | | | | | | | | | | | | | | | | | | | | | | | | | | | | | | | | | | | | | | | | | | | | | | | | | | | | | | | | | | | | | | | | | | | | | | | | | | | | | | | | | | | | | | | | | | | | | | | | | | | | | | | | | | | | | | | | | | | | | | | | | | | | | | | | | | | | | | | | | | | | | | | | | | | | | | | | | | | | | | | | | | | | | | | | | | | | | | | | | | | | | | | | | | | | | | | | | | Mr. Adamczyk | | $ | 805,492 | | | $ | 5,348 | | | $ | 810,840 | | | | | | | | | | | | | | | | | | | | | | | | | | | | | | | | | | | | | | | | | | | | | | | | | | | | | | | | | | | | | | | | | | | | | | | | | | | | | | | | | | | | | | | | | | | | | | | | Mr. Lewis | | $ | 253,033 | | | $ | 1,454 | | | $ | 254,487 | | | | | | | | | | | | | | | | | | | | | | | | | | | | | | | | | | | | | | | | | | | | | | | | | | | | | | | | | | | | | | | | | | | | | | | | | | | | | | | | | | | | | | | | | | | | | | | | Ms. Madden | | $ | 421,241 | | | $ | 38,557 | | | $ | 459,798 | | | | | | | | | | | | | | | | | | | | | | | | | | | | | | | | | | | | | | | | | | | | | | | | | | | | | | | | | | | | | | | | | | | | | | | | | | | | | | | | | | | | | | | | | | | | | | | | Mr. Gautam | | $ | 397,106 | (b) | | $ | 6,880 | | | $ | 403,986 | | | | | | | | | | | | | | | | | | | | | | | | | | | | | | | | | | | | | | | | | | | | | | | | | | | | | | | | | | | | | | | | | | | | | | | | | | | | | | | | | | | | | | | | | | | | | | | | Mr. Waldron | | $ | 189,939 | | | $ | 940 | | | $ | 190,879 | | | | | | | | | | | | | | | | | | | | | | | | | | | | | | | | | | | | | | | | | | | | | | | | | | | | | | | | | | | | | | | | | | | | | | | | | | | | | | | | | | | | | | | | | | | | | | | |
| (a) | The reported change in aggregate pension value for Mr. Gautam includes the impact of a decrease in the discount rate from 3.22% as of December 31, 2019, to 2.50% at December 31, 2020. The value of benefits for the other NEOs was calculated as the lump sum under their pension formula as of December 31, 2020, which is unaffected by interest rates.
|
| (b) | Excluding the impact of the decrease in discount rate during 2020, the change in pension value for Mr. Gautam was ($104,669).
|
| (c) | Represents earnings under the Honeywell Excess Benefit Plan, Honeywell Supplemental Savings Plan and Honeywell Deferred Incentive Plan that are in excess of that determined using SEC market interest rates.
|
(7) | For 2020, All Other Compensation consists of the following:
|
| | | | | | | | | | | | | | | | | | | | | | | | | | | | | | | | | | | | | | | | | | | | | | | | | | | NEO | | Matching Contributions(a) | | | Personal Use of Company Aircraft(b) | | | Security(c) | | | Excess Liability Insurance(d) | | | Executive
Physical/
Medical
Services (e) | | | Total Other Compensation | | | | | | | | | | | | | | | | | | | | | | | | | | | | Mr. Adamczyk | | $ | 109,631 | | | $ | 35,489 | | | $ | 22,418 | | | $ | 1,515 | | | $ | 9,150 | | | $ | 178,203 | | Mr. Lewis | | $ | 52,760 | | | | — | | | | — | | | $ | 1,515 | | | $ | 3,352 | | | $ | 57,627 | | Ms. Madden | | $ | 57,787 | | | $ | 22,739 | | | | — | | | $ | 1,515 | | | $ | 5,503 | | | $ | 87,544 | | Mr. Gautam | | $ | 53,788 | | | | — | | | | — | | | $ | 1,515 | | | $ | 1,220 | | | $ | 56,523 | | Mr. Waldron | | $ | 49,334 | | | | — | | | | — | | | $ | 1,515 | | | $ | 3,659 | | | $ | 54,508 | |
| (a) | Represents total Company matching contributions to each Named Executive Officer’s accounts in the tax-qualified Honeywell 401(k) Plan and the non-tax-qualified Supplemental Savings Plan.
|
| (b) | For security reasons, Mr. Adamczyk is required by Company policy to use Company aircraft for all business and personal travel (requirement to use Company aircraft for specific personal travel may be waived at the discretion of Honeywell’s security personnel). Other NEOs may have access to available corporate aircraft for personal travel, from time to time, if approved by the CEO. The amount shown for each NEO represents the aggregate incremental cost of personal travel. This amount is calculated by multiplying the total number of personal flight hours by the average direct variable operating costs (e.g., expenses for aviation employees, variable aircraft maintenance, telecommunications, transportation charges, including but not limited to hangar and landing fees, aviation fuel, and commissaries) per flight hour for Company aircraft.
|
| (c) | In accordance with the CEO security plan, represents the total paid by the Company in 2020 for expenses relating to personal residential security provided to protect Mr. Adamczyk.
|
| (d) | Represents the annual premiums paid by the Company to purchase excess liability insurance coverage for each Named Executive Officer.
|
| (e) | Represents cost of the annual executive physical covered by the Company (excess over insurance) and concierge medical services provided to Charlotte-based officers.
|
(8) | Represents total reportable compensation determined in accordance with SEC disclosure requirements.
|
(9) | Represents non-SEC supplemental information of Total Annual Direct Compensation (TADC) from the perspective of the MDCC (as discussed in the CD&A). For all years, this column excludes the amounts reflected in the (i) Change in Pension Value and Deferred Compensation Earnings, and (ii) All Other Compensation columns of the Summary Compensation Table (SCT). For 2020, this column also excludes the 2018-2020 performance cash award to Mr. Lewis (see footnote 5), which was awarded in 2018 and considered part of TADC by the MDCC in 2018 but required to be reported on the Summary Compensation Table as 2020 compensation (at the end of the three-year performance period) under SEC rules. For 2019, this column excludes the 2017-2019 performance cash awards to Mr. Lewis and Ms. Madden that were awarded in 2017 and considered part of TADC by the MDCC in 2017 but required to be reported on the Summary Compensation Table as 2019 compensation (at the end of the three-year performance period) under SEC rules. For 2018, this column includes the target value of the 2018-2020 performance cash award granted to Mr. Lewis in 2018 and considered part of TADC by the MDCC for 2018 even though not reported on the SCT until 2020. This column does not replace the compensation total shown on the SCT but is intended to show how the MDCC viewed TADC in each of the respective years.
|
| | | | | | | | | 71
| |
| | | |Notice and Proxy Statement | 2021 2022
| | | 79 |
EXECUTIVE COMPENSATION TABLES
| | | 07 | | | EXECUTIVE
COMPENSATION TABLES
|
OTHER COMPENSATION TABLES |
GRANTS OF PLAN-BASED AWARDS—FISCAL YEAR 2020 | | | | | | | | | | | | | | | | | | | | | | | | | | | | | | | | | | | | | | | | | | | | | | | | | | | | | | | | | | | | | | | | | | | | | | | | | | | | | | | | | | | | | | | | | | | | | | | | | | | | | | | | | | | | | | | Named Executive Officer | | | | | | | Estimated Future Payouts Under
Non-Equity Incentive Plan Awards | | | | | | Estimated Future Payouts Under
Equity Incentive Plan Awards(3) | | | All Other
Stock
Awards:
Number of
Shares of
Stock or
Units | | | All Other
Option
Awards:
Number of
Securities
of Option
Underlying
Options(4) | | | Exercise
or Base
Price
Awards
($/Sh) | | | Closing
Price on
Date of
Grant of
Option
Awards
($/Sh) | | | Grant Date
Fair Value
of Stock
and
Option
Awards(5) | | | | | | | | | | | | | | | | | | | | | | | | | | | | | | | | | | | | | | | | | | | | | | | | | | | | | | | | | | | | | | | | | | | | | | | | | | Award
Type(1) | | Grant
Date | | | Threshold(2) | | | Target | | | Maximum | | | | | | Threshold | | | Target | | | Maximum | | | | | | | | | | | | | | | | | | | | | | | | | | | | | | | | | | | | | | | | | | | | | | | | | | | | | | | | | | Darius Adamczyk | | ICP | | | | | | $ | 28,000 | | | $ | 2,800,000 | | | $ | 5,600,000 | | | | | | | | | | | | | | | | | | | | | | | | | | | | | | | | | | | | | | | | NQSO | | | 2/14/2020 | | | | | | | | | | | | | | | | | | | | | | | | | | | | | | | | | | | | 228,800 | | | | $180.92 | | | | $180.81 | | | $ | 4,898,608 | | | | PSU | | | 2/14/2020 | | | | | | | | | | | | | | | | | | | | 4,650 | | | | 37,200 | | | | 59,520 | | | | | | | | | | | | | | | | | | | $ | 7,014,804 | | | | RSU | | | 2/14/2020 | | | | | | | | | | | | | | | | | | | | | | | | | | | | | | | | 11,600 | | | | | | | | | | | | | | | $ | 2,098,672 | | Gregory P. Lewis | | ICP | | | | | | $ | 7,700 | | | $ | 770,000 | | | $ | 1,540,000 | | | | | | | | | | | | | | | | | | | | | | | | | | | | | | | | | | | | | | | | NQSO | | | 2/14/2020 | | | | | | | | | | | | | | | | | | | | | | | | | | | | | | | | | | | | 70,200 | | | | $180.92 | | | | $180.81 | | | $ | 1,502,982 | | | | PSU | | | 2/14/2020 | | | | | | | | | | | | | | | | | | | | 1,438 | | | | 11,500 | | | | 18,400 | | | | | | | | | | | | | | | | | | | $ | 2,168,555 | | | | RSU | | | 2/14/2020 | | | | | | | | | | | | | | | | | | | | | | | | | | | | | | | | 3,500 | | | | | | | | | | | | | | | $ | 633,220 | | Anne T. Madden | | ICP | | | | | | $ | 8,470 | | | $ | 847,000 | | | $ | 1,694,000 | | | | | | | | | | | | | | | | | | | | | | | | | | | | | | | | | | | | | | | | NQSO | | | 2/14/2020 | | | | | | | | | | | | | | | | | | | | | | | | | | | | | | | | | | | | 70,200 | | | | $180.92 | | | | $180.81 | | | $ | 1,502,982 | | | | PSU | | | 2/14/2020 | | | | | | | | | | | | | | | | | | | | 1,438 | | | | 11,500 | | | | 18,400 | | | | | | | | | | | | | | | | | | | $ | 2,168,555 | | | | RSU | | | 2/14/2020 | | | | | | | | | | | | | | | | | | | | | | | | | | | | | | | | 3,500 | | | | | | | | | | | | | | | $ | 633,220 | | Rajeev Gautam | | ICP | | | | | | $ | 7,850 | | | $ | 785,000 | | | $ | 1,570,000 | | | | | | | | | | | | | | | | | | | | | | | | | | | | | | | | | | | | | | | | NQSO | | | 2/14/2020 | | | | | | | | | | | | | | | | | | | | | | | | | | | | | | | | | | | | 68,600 | | | | $180.92 | | | | $180.81 | | | $ | 1,468,726 | | | | PSU | | | 2/14/2020 | | | | | | | | | | | | | | | | | | | | 700 | | | | 11,200 | | | | 17,920 | | | | | | | | | | | | | | | | | | | $ | 2,111,984 | | | | RSU | | | 2/14/2020 | | | | | | | | | | | | | | | | | | | | | | | | | | | | | | | | 3,400 | | | | | | | | | | | | | | | $ | 615,128 | | John F. Waldron | | ICP | | | | | | $ | 7,200 | | | $ | 720,000 | | | $ | 1,440,000 | | | | | | | | | | | | | | | | | | | | | | | | | | | | | | | | | | | | | | | | NQSO | | | 2/14/2020 | | | | | | | | | | | | | | | | | | | | | | | | | | | | | | | | | | | | 57,200 | | | | $180.92 | | | | $180.81 | | | $ | 1,224,652 | | | | PSU | | | 2/14/2020 | | | | | | | | | | | | | | | | | | | | 581 | | | | 9,300 | | | | 14,880 | | | | | | | | | | | | | | | | | | | $ | 1,753,701 | | | | RSU | | | 2/14/2020 | | | | | | | | | | | | | | | | | | | | | | | | | | | | | | | | 2,900 | | | | | | | | | | | | | | | $ | 524,668 | |
| ICP = Incentive Compensation Plan (for 2020 performance year, paid in 2021)
|
| NQSO = Nonqualified Stock Option
|
| PSU = Performance Stock Unit (3-year Performance Plan award)
|
| RSU = Restricted Stock Unit
|
(2) | 2021 | | | | | | | | | | | | | | | | | | | | | | | | | | | | | | | | | | | | | | | | | | | | | | | | | | | | | | | | | Named
Executive
Officer | Award Type(1) | Grant Date | Estimated Future Payouts Under Non-Equity Incentive Plan Awards | | Estimated Future Payouts Under Equity Incentive Plan Awards(3) | All Other Stock Awards: Number of Shares of Stock or Units(4) | All Other Option Awards: Number of Securities Underlying Options(5) | Exercise or Base Price of Option Awards ($/Sh) | Closing Price on Date of Grant of Option Awards ($/Sh) | Grant Date Fair Value of Stock and Option Awards(6) | Threshold(2) | | Target | | Maximum | | Threshold | Target | Maximum | | Darius Adamczyk | ICP | | | $ | 29,323 | | | $ | 2,932,328 | | | $ | 5,864,656 | | | | | | | | | | | | | NQSO | 2/12/2021 | | | | | | | | | | | | 163,500 | $202.72 | | $203.57 | | | $ | 5,248,350 | | | PSU21-23 | 3/15/2021 | | | | | | | | 3,861 | 35,300 | 70,600 | | | | | | $ | 7,502,309 | | | RSU | 2/12/2021 | | | | | | | | | | | 11,000 | | | | | $ | 2,229,920 | | | PSU20-22 | 3/15/2021 | | | | | | | | | | | | | | | | $ | 4,754,160 | | | Gregory P. Lewis | ICP | | | $ | 8,305 | | | $ | 830,493 | | | $ | 1,660,986 | | | | | | | | | | | | | NQSO | 2/12/2021 | | | | | | | | | | | | 51,200 | $202.72 | | $203.57 | | | $ | 1,643,520 | | | PSU21-23 | 3/15/2021 | | | | | | | | 1,214 | 11,100 | 22,200 | | | | | | $ | 2,359,083 | | | RSU | 2/12/2021 | | | | | | | | | | | 3,400 | | | | | $ | 689,248 | | | PSU20-22 | 3/15/2021 | | | | | | | | | | | | | | | | $ | 1,469,700 | | | Anne T. Madden | ICP | | | $ | 8,695 | | | $ | 869,458 | | | $ | 1,738,916 | | | | | | | | | | | | | NQSO | 2/12/2021 | | | | | | | | | | | | 51,200 | $202.72 | | $203.57 | | | $ | 1,643,520 | | | PSU21-23 | 3/15/2021 | | | | | | | | 1,214 | 11,100 | 22,200 | | | | | | $ | 2,359,083 | | | RSU | 2/12/2021 | | | | | | | | | | | 3,400 | | | | | $ | 689,248 | | | PSU20-22 | 3/15/2021 | | | | | | | | | | | | | | | | $ | 1,449,700 | | | Que Thanh Dallara | ICP | | | $ | 6,765 | | | $ | 676,466 | | | $ | 1,352,932 | | | | | | | | | | | | | NQSO | 2/12/2021 | | | | | | | | | | | | 42,500 | $202.72 | | $203.57 | | | $ | 1,364,250 | | | PSU21-23 | 3/15/2021 | | | | | | | | 1,006 | 9,200 | 18,400 | | | | | | $ | 1,955,276 | | | RSU | 2/12/2021 | | | | | | | | | | | 2,800 | | | | | $ | 567,616 | | | PSU20-22 | 3/15/2021 | | | | | | | | | | | | | | | | $ | 1,337,108 | | | Mike Madsen | ICP | | | $ | 7,371 | | | $ | 737,052 | | | $ | 1,474,104 | | | | | | | | | | | | | NQSO | 2/12/2021 | | | | | | | | | | | | 34,100 | $202.72 | | $203.57 | | | $ | 1,094,610 | | | PSU21-23 | 3/15/2021 | | | | | | | | 809 | 7,400 | 14,800 | | | | | | $ | 1,572,722 | | | RSU | 2/12/2021 | | | | | | | | | | | 2,300 | | | | | $ | 466,256 | | | PSU20-22 | 3/15/2021 | | | | | | | | | | | | | | | | $ | 898,594 | |
(1)Award Type: ICP = Incentive Compensation Plan (for 2021 performance year, paid in 2022) NQSO = Nonqualified Stock Option PSU21-23 = 2021-2023 Performance Stock Unit (regular annual award) RSU = Restricted Stock Unit PSU20-22 = 2020-2022 Performance Stock Unit (modification) (2)Represents the minimum level of performance that must be achieved for any amount to be payable. |
(3) | The amount in the Target column represents the number of PSUs awarded to the Named Executive Officer in 2020 under the 2016 Stock Incentive Plan. Actual earned PSU awards may range from 0% to 160% based on performance against plan metrics over the performance period ending December 31, 2022. Awards vest 100% in February 2023. 50% of the total number of PSUs earned will be converted to, and paid in, cash. 50% of the earned PSUs shall be paid in shares subject to a minimum one-year holding period.
|
(4) | Represents the number of RSUs awarded to the Named Executive Officer in 2020 under the 2016 Stock Incentive Plan.
|
(5) | NQSO awards in this column represent the number of annual stock options awarded to the Named Executive Officers on the Grant Date. These stock options vest in equal annual installments over a period of four years and have a ten-year term. The exercise price is equal to the fair market value of Honeywell stock on the date of grant.
|
(6) | The grant date fair value of each NQSO in this column was $21.41, calculated in accordance with FASB ASC Topic 718, using the Black-Scholes option valuation model at the time of grant. A more detailed discussion of the assumptions used in the valuation of stock option awards may be found in Note 16 of the Notes to the Financial Statements in the Company’s Form 10-K for the year ended December 31, 2020. The grant date fair value of each RSU was $180.92 based on the FMV of Honeywell stock on the Grant Date. The grant date unit value for each PSU with a Grant Date of February 14, 2020 was $188.57, determined based on the fair market value of Honeywell stock on the date of grant of $180.92 for the three internal financial metrics, and a value of $211.53 for the relative TSR metric.
|
Description of Plan-Basedperformance that must be achieved for any amount to be payable.
(3)The amount in the Target column represents the number of PSUs awarded to the Named Executive Officer in 2021 under the 2016 Stock Incentive Plan for the performance period of January 1, 2021 - December 31, 2023. Actual earned PSU awards may range from 0% to 200% based on performance against plan metrics over the three-year performance period. Awards vest 100% in February 2024. 50% of the total number of PSUs earned will be converted to, and paid in, cash. 50% of the earned PSUs will be paid in shares subject to a minimum one-year holding period. (4)Represents the number of RSUs awarded to the Named Executive Officer in 2021 under the 2016 Stock Incentive Plan. These RSUs vest in three installments; 33% on each of the second and fourth anniversaries of the grant date and 34% on the sixth anniversary of the grant date. (5)NQSO awards in this column represent the number of annual stock options awarded to the Named Executive Officers on the Grant Date. These stock options vest in equal annual installments over a period of four years and have a ten-year term. The exercise price is equal to the fair market value of Honeywell stock on the date of grant. (6)The grant date fair value of each NQSO in this column was $32.10, calculated in accordance with FASB ASC Topic 718, using the Black-Scholes option valuation model at the time of grant. A more detailed discussion of the assumptions used in the valuation of stock option awards may be found in Note 15 of the Notes to the Financial Statements in the Company’s Form 10-K for the year ended December 31, 2021. The grant date fair value of each RSU was $202.72 based on the fair market value of Honeywell stock on the grant date. The grant date fair value for each PSU21-23 was $212.53, determined based on the fair market value of Honeywell stock on the date of grant (March 15, 2021) of $214.85 for the three internal financial metrics, and a value of $205.57 for the Relative TSR metric. The value for each PSU20-22 represents the incremental fair value of the 2020-2022 PSUs, that were originally granted on February 14, 2020 and modified on March 15, 2021, of $127.80 per PSU, computed as of the modification date in accordance with FASB ASC Topic 718. DESCRIPTION OF PLAN-BASED AWARDS All NQSO, PSU, and RSU awards granted to the Named Executive Officers in fiscal year 20202021 were granted under the Company’s 2016 Stock Incentive Plan and are governed by and subject to the terms and conditions of the 2016 Stock Incentive Plan and the relevant award agreements. A detailed discussion of these long-term incentive awards can be found beginning on page 5965 of this Proxy Statement. | | | | |
| | | Notice and Proxy Statement | 2021
| | 72
|
| | | 07 | | | EXECUTIVE
COMPENSATION TABLES
|
I OUTSTANDING EQUITY AWARDS AT 2020 FISCAL YEAR-END
| | | | | | | | | | | | | | | | | | | | | | | | | | | | | | | | | | | | | | | | | | | | | Option Awards(1) | | | | | | Stock Awards | | | | | | | | | | | Name | | Grant
Year | | | Number of
Securities
Underlying
Unexercised
Options
Exercisable | | | Number of
Securities
Underlying
Unexercised
Options
Unexercisable | | | Option
Exercise
Price | | | Option
Expiration
Date | | | | | | Number of
Shares or
Units of
Stock That
Have Not
Vested | | | Market
Value of
Shares or
Units of
Stock That
Have Not
Vested(2) | | Darius Adamczyk | | | 2020 | | | | — | | | | 228,800 | | | $ | 180.92 | | | | 2/13/2030 | | | | | | | | 11,844 | (3) | | $ | 2,519,219 | | | | | 2020 | | | | — | | | | — | | | | — | | | | — | | | | | | | | 37,983 | (4) | | $ | 8,078,984 | | | | | 2019 | | | | 53,825 | | | | 161,475 | | | $ | 154.22 | | | | 2/25/2029 | | | | | | | | 13,262 | (5) | | $ | 2,820,827 | | | | | 2019 | | | | — | | | | — | | | | — | | | | — | | | | | | | | 42,895 | (6) | | $ | 9,123,767 | | | | | 2018 | | | | 70,342 | | | | 70,343 | | | $ | 148.79 | | | | 2/26/2028 | | | | | | | | 15,175 | (7) | | $ | 3,227,723 | | | | | 2018 | | | | — | | | | — | | | | — | | | | — | | | | | | | | 68,938 | (8) | | $ | 14,663,113 | | | | | 2017 | | | | 169,198 | | | | 56,400 | | | $ | 119.69 | | | | 2/27/2027 | | | | | | | | — | | | | — | | | | | 2016 | | | | 105,040 | | | | — | | | $ | 107.42 | | | | 4/3/2026 | | | | | | | | — | | | | — | | | | | 2016 | | | | 157,561 | | | | — | | | $ | 98.70 | | | | 2/24/2026 | | | | | | | | 38,598 | (9) | | $ | 8,209,795 | | | | | 2015 | | | | 157,561 | | | | — | | | $ | 98.93 | | | | 2/25/2025 | | | | | | | | — | | | | — | | | | | 2014 | | | | 147,058 | | | | — | | | $ | 89.48 | | | | 2/26/2024 | | | | | | | | 10,613 | (10) | | $ | 2,257,385 | | | | | 2013 | | | | 42,015 | | | | — | | | $ | 66.43 | | | | 2/26/2023 | | | | | | | | — | | | | — | | | | | | Total | | | | 902,600 | | | | 517,018 | | | | | | | | | | | | | | | | 239,308 | | | $ | 50,900,812 | | Gregory P. Lewis | | | 2020 | | | | — | | | | 70,200 | | | $ | 180.92 | | | | 2/13/2030 | | | | | | | | 3,574 | (3) | | $ | 760,190 | | | | | 2020 | | | | — | | | | — | | | | — | | | | — | | | | | | | | 11,742 | (4) | | $ | 2,497,523 | | | | | 2019 | | | | 14,200 | | | | 42,600 | | | $ | 154.22 | | | | 2/25/2029 | | | | | | | | 3,523 | (5) | | $ | 749,342 | | | | | 2019 | | | | — | | | | — | | | | — | | | | — | | | | | | | | 11,397 | (6) | | $ | 2,424,142 | | | | | 2018 | | | | 13,054 | | | | 13,056 | | | $ | 148.79 | | | | 2/26/2028 | | | | | | | | 3,945 | (11) | | $ | 839,102 | | | | | 2017 | | | | 19,582 | | | | 6,528 | | | $ | 119.69 | | | | 2/27/2027 | | | | | | | | — | | | | — | | | | | 2016 | | | | — | | | | — | | | | — | | | | — | | | | | | | | 3,819 | (12) | | $ | 812,301 | | | | | 2016 | | | | 25,209 | | | | — | | | $ | 98.70 | | | | 2/24/2026 | | | | | | | | — | | | | — | | | | | 2015 | | | | 23,107 | | | | — | | | $ | 98.93 | | | | 2/25/2025 | | | | | | | | 2,002 | (13) | | $ | 425,825 | | | | | 2014 | | | | 21,007 | | | | — | | | $ | 89.48 | | | | 2/26/2024 | | | | | | | | — | | | | — | | | | | 2013 | | | | 6,301 | | | | — | | | $ | 66.43 | | | | 2/26/2023 | | | | | | | | — | | | | — | | | | | 2012 | | | | 6,301 | | | | — | | | $ | 57.00 | | | | 2/28/2022 | | | | | | | | — | | | | — | | | | | | Total | | | | 128,761 | | | | 132,384 | | | | | | | | | | | | | | | | 40,002 | | | $ | 8,508,425 | | Anne T. Madden | | | 2020 | | | | — | | | | 70,200 | | | $ | 180.92 | | | | 2/13/2030 | | | | | | | | 3,574 | (3) | | $ | 760,190 | | | | | 2020 | | | | — | | | | — | | | | — | | | | — | | | | | | | | 11,742 | (4) | | $ | 2,497,523 | | | | | 2019 | | | | 14,200 | | | | 42,600 | | | $ | 154.22 | | | | 2/25/2029 | | | | | | | | 3,523 | (5) | | $ | 749,342 | | | | | 2019 | | | | — | | | | — | | | | — | | | | — | | | | | | | | 11,397 | (6) | | $ | 2,424,142 | | | | | 2018 | | | | 15,979 | | | | 15,980 | | | $ | 148.79 | | | | 2/26/2028 | | | | | | | | 3,406 | (7) | | $ | 724,456 | | | | | 2018 | | | | — | | | | — | | | | — | | | | — | | | | | | | | 15,734 | (8) | | $ | 3,346,622 | | | | | 2017 | | | | 21,149 | | | | 7,050 | | | $ | 119.69 | | | | 2/27/2027 | | | | | | | | — | | | | — | | | | | 2016 | | | | 28,885 | | | | — | | | $ | 98.70 | | | | 2/24/2026 | | | | | | | | 6,175 | (9) | | $ | 1,313,423 | | | | | 2015 | | | | 26,259 | | | | — | | | $ | 98.93 | | | | 2/25/2025 | | | | | | | | — | | | | — | | | | | 2014 | | | | 21,007 | | | | — | | | $ | 89.48 | | | | 2/26/2024 | | | | | | | | — | | | | — | | | | | 2013 | | | | 21,007 | | | | — | | | $ | 66.43 | | | | 2/26/2023 | | | | | | | | — | | | | — | | | | | | Total | | | | 148,486 | | | | 135,830 | | | | | | | | | | | | | | | | 55,551 | | | $ | 11,815,698 | |
| | | | | | | | | 73
80 | |
| | | |Notice and Proxy Statement | 2021
| | | 2022 |
EXECUTIVE COMPENSATION TABLES
OUTSTANDING EQUITY AWARDS AT 2021 FISCAL YEAR-END | | | | | | | | | | | | | | | | | | | | | | | | | | | | | | | | | | | | | | | | | | | | Option Awards (1) | | | | Stock Awards | | Name | Grant
Year | Number of Securities Underlying Unexercised Options Exercisable | Number of Securities Underlying Unexercised Options Unexercisable | Option Exercise Price | Option Expiration Date | | Number of Shares or Units of Stock that Have Not Vested | | Market Value of Shares or Units of Stock That Have Not Vested(2) | | Number of Unearned Shares or Units of Stock that Have Not Vested | | Market Value of Shares or Units of Stock That Have Not Vested(2) | | | | | | | | | | | | | | | | | | | | | | | | | | | | | | Darius Adamczyk | 2021 | — | | 163,500 | | $202.72 | | 2/11/2031 | | 11,191 | | (3) | $2,333,435 | | | 35,758 | | (4) | $7,455,901 | | | 2020 | 57,200 | | 171,600 | | $180.92 | | 2/13/2030 | | 12,050 | | (5) | $2,512,546 | | | 38,643 | | (6) | $8,057,452 | | | 2019 | 107,650 | | 107,650 | | $154.22 | | 2/25/2029 | | 9,040 | | (7) | $1,884,930 | | | — | | | — | | | 2019 | — | | — | | — | | — | | | 37,967 | | (8) | $7,916,499 | | | — | | | — | | | 2018 | 105,513 | | 35,172 | | $148.79 | | 2/26/2028 | | 15,439 | | (9) | $3,219,186 | | | — | | | — | | | 2017 | 225,598 | | — | | $119.69 | | 2/27/2027 | | — | | | — | | | — | | | — | | | 2016 | 105,040 | | — | | $107.42 | | 4/3/2026 | | — | | | — | | | — | | | — | | | 2016 | 157,561 | | — | | $98.70 | | 2/24/2026 | | 19,923 | | (10) | $4,154,145 | | | — | | | — | | | 2015 | 157,561 | | — | | $98.93 | | 2/25/2025 | | — | | | — | | | — | | | — | | | 2014 | 147,058 | | — | | $89.48 | | 2/26/2024 | | — | | | — | | | — | | | — | | | Total | 1,063,181 | | 477,922 | | | | | 105,610 | | | $22,020,741 | | | 74,401 | | | $15,513,353 | | | Gregory P. Lewis | 2021 | — | | 51,200 | | $202.72 | | 2/11/2031 | | 3,459 | | (3) | $721,236 | | | 11,244 | | (4) | $2,344,486 | | | 2020 | 17,550 | | 52,650 | | $180.92 | | 2/13/2030 | | 3,636 | | (5) | $758,142 | | | 11,946 | | (6) | $2,490,860 | | | 2019 | 28,400 | | 28,400 | | $154.22 | | 2/25/2029 | | 2,401 | | (7) | $500,633 | | | — | | | — | | | 2019 | — | | — | | — | | — | | | 10,088 | | (8) | $2,103,449 | | | — | | | — | | | 2018 | 19,582 | | 6,528 | | $148.79 | | 2/26/2028 | | — | | | — | | | — | | | — | | | 2017 | 26,110 | | — | | $119.69 | | 2/27/2027 | | — | | | — | | | — | | | — | | | 2016 | — | | — | | — | | — | | | 1,972 | | (11) | $411,182 | | | — | | | — | | | 2016 | 25,209 | | — | | $98.70 | | 2/24/2026 | | — | | | — | | | — | | | — | | | 2015 | 23,107 | | — | | $98.93 | | 2/25/2025 | | 2,036 | | (12) | $424,526 | | | — | | | — | | | 2014 | 21,007 | | — | | $89.48 | | 2/26/2024 | | — | | | — | | | — | | | — | | | Total | 160,965 | | 138,778 | | | | | 23,592 | | | $4,919,168 | | | 23,190 | | | $4,835,346 | | | Anne T. Madden | 2021 | — | | 51,200 | | $202.72 | | 2/11/2031 | | 3,459 | | (3) | $721,236 | | | 11,244 | | (4) | $2,344,486 | | | 2020 | 17,550 | | 52,650 | | $180.92 | | 2/13/2030 | | 3,636 | | (5) | $758,142 | | | 11,946 | | (6) | $2,490,860 | | | 2019 | 28,400 | | 28,400 | | $154.22 | | 2/25/2029 | | 2,401 | | (7) | $500,633 | | | — | | | — | | | 2019 | — | | — | | — | | — | | | 10,088 | | (8) | $2,103,449 | | | — | | | — | | | 2018 | 23,969 | | 7,990 | | $148.79 | | 2/26/2028 | | 3,465 | | (9) | $722,487 | | | — | | | — | | | 2017 | 28,199 | | — | | $119.69 | | 2/27/2027 | | — | | | — | | | — | | | — | | | 2016 | 28,885 | | — | | $98.70 | | 2/24/2026 | | 3,190 | | (13) | $665,147 | | | — | | | — | | | 2015 | 26,259 | | — | | $98.93 | | 2/25/2025 | | — | | | — | | | — | | | — | | | 2014 | 21,007 | | — | | $89.48 | | 2/26/2024 | | — | | | — | | | — | | | — | | | Total | 174,269 | | 140,240 | | | | | 26,239 | | | $5,471,094 | | | 23,190 | | | $4,835,346 | | Que Thanh Dallara (20) | 2021 | — | | 42,500 | | $202.72 | | 2/11/2031 | | 2,849 | | (3) | $594,045 | | | 9,319 | | (4) | $1,943,105 | | | 2020 | 14,300 | | 42,900 | | $180.92 | | 2/13/2030 | | 3,013 | | (5) | $628,241 | | | 9,661 | | (6) | $2,014,415 | | | 2019 | 21,800 | | 21,800 | | $154.22 | | 2/25/2029 | | 1,836 | | (7) | $382,824 | | | — | | | — | | | 2019 | — | | — | | — | | — | | | 8,766 | | (8) | $1,827,799 | | | — | | | — | | | 2018 | 16,527 | | 5,510 | | $148.79 | | 2/26/2028 | | 2,412 | | (9) | $502,926 | | | — | | | — | | | 2018 | — | | — | | — | | — | | | 2,664 | | (14) | $555,471 | | | — | | | — | | | 2017 | 13,577 | | — | | $119.69 | | 2/27/2027 | | 924 | | (15) | $192,663 | | | — | | | — | | | Total | 66,204 | | 112,710 | | | | | 22,464 | | | $4,683,969 | | | 18,980 | | | $3,957,520 | | | Mike Madsen | 2021 | — | | 34,100 | | $202.72 | | 2/11/2031 | | 2,340 | | (3) | $487,913 | | | 7,496 | | (4) | $1,562,991 | | | 2020 | 11,425 | | 34,275 | | $180.92 | | 2/13/2030 | | 2,389 | | (5) | $498,130 | | | 7,791 | | (6) | $1,624,501 | | | 2019 | 11,866 | | 11,869 | | $154.22 | | 2/25/2029 | | 3,493 | | (16) | $728,325 | | | — | | | — | | | 2019 | — | | — | | — | | — | | | 6,066 | | (17) | $1,264,822 | | | — | | | — | | | 2018 | 18,015 | | 6,006 | | $148.79 | | 2/26/2028 | | — | | | — | | | — | | | — | | | 2017 | 24,021 | | — | | $119.69 | | 2/27/2027 | | 1,941 | | (18) | $404,718 | | | — | | | — | | | 2016 | 23,107 | | — | | $98.70 | | 2/24/2026 | | 1,994 | | (19) | $415,769 | | | — | | | — | | | 2015 | 13,696 | | — | | $98.93 | | 2/25/2025 | | — | | | — | | | — | | | — | | | 2014 | 16,007 | | — | | $89.48 | | 2/26/2024 | | — | | | — | | | — | | | — | | | Total | 118,137 | | 86,250 | | | | | 18,223 | | | $3,799,677 | | | 15,287 | | | $3,187,492 | |
| | | 07 | | | EXECUTIVE
COMPENSATION TABLES
|
| | | | | | | | | | | | | | | | | | | | | | | | | | | | | | | | | | | | | | | | | | | | | Option Awards(1) | | | | | | Stock Awards | | | | | | | | | | | Name | | Grant
Year | | | Number of
Securities
Underlying
Unexercised
Options
Exercisable | | | Number of
Securities
Underlying
Unexercised
Options
Unexercisable | | | Option
Exercise
Price | | | Option
Expiration
Date | | | | | | Number of
Shares or
Units of
Stock That
Have Not
Vested | | | Market
Value of
Shares or
Units of
Stock That
Have Not
Vested(2) | | Rajeev Gautam | | | 2020 | | | | — | | | | 68,600 | | | $ | 180.92 | | | | 2/13/2030 | | | | | | | | 3,472 | (3) | | $ | 738,494 | | | | | 2020 | | | | — | | | | — | | | | — | | | | — | | | | | | | | 11,436 | (4) | | $ | 2,432,437 | | | | | 2019 | | | | 16,400 | | | | 49,200 | | | $ | 154.22 | | | | 2/25/2029 | | | | | | | | 4,041 | (5) | | $ | 859,521 | | | | | 2019 | | | | — | | | | — | | | | — | | | | — | | | | | | | | 13,055 | (6) | | $ | 2,776,799 | | | | | 2018 | | | | 21,619 | | | | 21,620 | | | $ | 148.79 | | | | 2/26/2028 | | | | | | | | 4,665 | (7) | | $ | 992,246 | | | | | 2018 | | | | — | | | | — | | | | — | | | | — | | | | | | | | 13,921 | (8) | | $ | 2,960,997 | | | | | 2017 | | | | 54,832 | | | | 18,278 | | | $ | 119.69 | | | | 2/27/2027 | | | | | | | | — | | | | — | | | | | 2016 | | | | 52,520 | | | | — | | | $ | 108.87 | | | | 5/1/2026 | | | | | | | | — | | | | — | | | | | 2016 | | | | 23,107 | | | | — | | | $ | 98.70 | | | | 2/24/2026 | | | | | | | | 11,523 | (14) | | $ | 2,450,942 | | | | | 2015 | | | | 21,007 | | | | — | | | $ | 98.93 | | | | 2/25/2025 | | | | | | | | — | | | | — | | | | | 2014 | | | | 17,856 | | | | — | | | $ | 89.48 | | | | 2/26/2024 | | | | | | | | — | | | | — | | | | | 2013 | | | | 8,927 | | | | — | | | $ | 66.43 | | | | 2/26/2023 | | | | | | | | — | | | | — | | | | | 2012 | | | | 4,200 | | | | — | | | $ | 57.00 | | | | 2/28/2022 | | | | | | | | — | | | | — | | | | | | Total | | | | 220,468 | | | | 157,698 | | | | | | | | | | | | | | | | 62,113 | | | $ | 13,211,435 | | John F. Waldron | | | 2020 | | | | — | | | | 57,200 | | | $ | 180.92 | | | | 2/13/2030 | | | | | | | | 2,961 | (3) | | $ | 629,805 | | | | | 2020 | | | | — | | | | — | | | | — | | | | — | | | | | | | | 9,496 | (4) | | $ | 2,019,799 | | | | | 2019 | | | | 13,000 | | | | 39,000 | | | $ | 154.22 | | | | 2/25/2029 | | | | | | | | 3,212 | (5) | | $ | 683,192 | | | | | 2019 | | | | — | | | | — | | | | — | | | | — | | | | | | | | 10,361 | (6) | | $ | 2,203,785 | | | | | 2018 | | | | — | | | | — | | | | — | | | | — | | | | | | | | 5,007 | (15) | | $ | 1,064,989 | | | | | 2018 | | | | 14,883 | | | | 14,883 | | | $ | 148.79 | | | | 2/26/2028 | | | | | | | | 3,185 | (7) | | $ | 677,450 | | | | | 2018 | | | | — | | | | — | | | | — | | | | — | | | | | | | | 14,215 | (8) | | $ | 3,023,531 | | | | | 2017 | | | | 43,082 | | | | 14,361 | | | $ | 119.69 | | | | 2/27/2027 | | | | | | | | — | | | | — | | | | | 2016 | | | | 33,612 | | | | — | | | $ | 98.70 | | | | 2/24/2026 | | | | | | | | 7,719 | (9) | | $ | 1,641,831 | | | | | 2015 | | | | 31,511 | | | | — | | | $ | 98.93 | | | | 2/25/2025 | | | | | | | | 3,201 | (10) | | $ | 680,853 | | | | | 2014 | | | | 21,007 | | | | — | | | $ | 89.48 | | | | 2/26/2024 | | | | | | | | 6,182 | (16) | | $ | 1,314,911 | | | | | 2013 | | | | 3,938 | | | | — | | | $ | 66.43 | | | | 2/26/2023 | | | | | | | | — | | | | — | | | | | | Total | | | | 161,033 | | | | 125,444 | | | | | | | | | | | | | | | | 65,539 | | | $ | 13,940,145 | |
(1) | Stock option grants vest in four installments at the rate of 25% per year beginning on the first anniversary of the date of grant.
|
(2) | Market value determined using the closing market price of $212.70 per share of common stock on December 31, 2020.
|
(3) | 2020 RSU grants will vest 33% on each of February 14, 2022 and February 14, 2024, with the remaining RSUs vesting on February 14, 2026. The number of RSUs reflected here includes dividend equivalents applied through December 31, 2020, which were reinvested as additional unvested RSUs that will vest based on the same vesting schedule as the RSUs to which they relate.
|
(4) | Represents PSUs issued under the 2020-2022 Performance Plan. Actual payout will be based on final performance against plan metrics for the full three-year cycle. The number of PSUs reflected here includes dividend equivalents applied on the target number of shares through December 31, 2020, which were reinvested as additional unvested PSUs that will vest on the same basis as the underlying PSUs to which they relate.
|
(5) | 2019 RSU grants vest 33% on each of February 26, 2021 and February 26, 2023, with the remaining RSUs vesting on February 26, 2025. The number of RSUs reflected here include dividend equivalents applied through December 31, 2020, which were reinvested as additional RSUs that will vest based on the same vesting schedule as the RSUs to which they relate.
|
(6) | Represents PSUs issued under the 2019-2021 Performance Plan. Actual payout will be based on final performance against plan metrics for the full three-year cycle. The number of PSUs reflected here includes dividend equivalents applied on the target number of shares through December 31, 2020, which were reinvested as additional unvested PSUs that will vest on the same basis as the underlying PSUs to which they relate.
|
(7) | A portion of these RSUs vested on February 27, 2020. The remaining RSUs will vest 49% on February 27, 2022, and 51% February 27, 2024. The number of RSUs reflected here include dividend equivalents applied through December 31, 2020, which were reinvested as additional RSUs that will vest based on the same vesting schedule as the RSUs to which they relate.
|
(8) | Represents the total number of PSUs earned under the 2018-2020 Performance Plan for the three-year performance period of January 1, 2018–December 31, 2020, which vested on February 27, 2021. The number of PSUs reflected here includes dividend equivalents applied on the number of PSUs earned, as if reinvested in additional PSUs over performance period, and vested on the same basis as the underlying PSUs to which they relate. 50% of the PSUs earned were converted to shares of Company common stock and issued to each NEO, subject to the holding period requirements for officers. The remaining 50% of PSUs earned was converted to cash based on the closing price of Honeywell stock on the last day of the performance period and paid to each NEO in the first quarter following the end of the performance period.
|
(9) | Represents Performance RSUs which achieved a 200% payout percentage based on Honeywell’s TSR performance relative to the Compensation Peer Group over a three-year period of August 1, 2016–July 31, 2019. A portion of these RSUs vested in July 2019, at the end of the three-year performance period, and the remaining RSUs will vest 49% on July 31, 2021, and 51% on July 31, 2023. The number of Performance RSUs reflected here includes dividend equivalents applied through December 31, 2019, which were reinvested as additional unvested Performance RSUs that will be adjusted and vest on the same basis as the underlying Performance RSUs to which they relate.
|
(10) | 33% of these RSUs vested on July 25, 2017, and 33% vested on July 25, 2019. The remaining RSUs will vest on July 25, 2021. The number of RSUs reflected here includes dividend equivalents applied through December 31, 2020, which were reinvested as additional unvested RSUs that will vest based on the same vesting schedule of the RSUs to which they relate.
|
(11) | These RSUs vested 100% on February 27, 2021. The number of RSUs reflected here includes dividend equivalents applied through December 31, 2020, which were reinvested as additional RSUs that vested based on the same vesting schedule of the RSUs to which they relate.
|
(12) | A portion of these RSUs vested on October 3, 2019. The remaining RSUs will vest 49% on October 3, 2021, and 51% on October 3, 2023. The number of RSUs reflected here includes dividend equivalents applied through December 31, 2020, which were reinvested as additional unvested RSUs that will vest based on the same vesting schedule of the RSUs to which they relate.
|
(13) | 33% of these RSUs vested on July 31, 2018, and 33% vested July 31, 2020. The remaining RSUs will vest July 31, 2022. The number of RSUs reflected here includes dividend equivalents applied through December 31, 2020, which were reinvested as additional unvested RSUs that will vest based on the same vesting schedule of the RSUs to which they relate.
|
(14) | Represents Performance RSUs which achieved a 200% payout percentage based on Honeywell’s TSR performance relative to the Compensation Peer Group over a three-year period of August 1, 2016–July 31, 2019. A portion of these RSUs vested in July 2019, at the end of the three-year performance period, and the remaining RSUs will vest 100% on July 31, 2021. The number of Performance RSUs reflected here includes dividend equivalents applied through December 31, 2020, which were reinvested as additional unvested Performance RSUs that will be adjusted and vest on the same basis as the underlying Performance RSUs to which they relate.
|
(15) | A portion of these RSUs vested on December 6, 2020. The remaining RSUs will vest 49% on December 6, 2022, and 51% on December 6, 2024. The number of RSUs reflected here includes dividend equivalents applied through December 31, 2020, which were reinvested as additional unvested RSUs that will vest based on the same vesting schedule of the RSUs to which they relate.
|
(16) | 33% of these RSUs vested on February 27, 2017, and 33% vested on February 27, 2019. The remaining RSUs vested on February 27, 2021. The number of RSUs reflected here includes dividend equivalents applied through December 31, 2020, which were reinvested as additional RSUs that vested based on the same vesting schedule of the RSUs to which they relate.
|
| | | | |
| | |Notice and Proxy Statement | 2021 2022
| | 74
81 |
EXECUTIVE COMPENSATION TABLES
(1)Stock option grants vest in four installments at the rate of 25% per year beginning on the first anniversary of the date of grant. (2)Market value determined using the closing market price of $208.51 per share of common stock on December 31, 2021. (3)2021 RSU grants will vest 33% on each of February 12, 2023 and February 12, 2025, with the remaining RSUs vesting on February 12, 2027. The number of RSUs reflected on the table includes dividend equivalents applied through December 31, 2021, which were reinvested as additional unvested RSUs that will vest based on the same vesting schedule as the RSUs to which they relate. (4)Represents PSUs issued under the 2021-2023 Performance Plan. Actual payout will be based on final performance against plan metrics for the full three-year cycle. The number of PSUs reflected on the table includes dividend equivalents applied on the target number of shares through December 31, 2021, which were reinvested as additional unvested PSUs that will vest on the same basis as the underlying PSUs to which they relate. (5)2020 RSU grants will vest 33% on each of February 14, 2022 and February 14, 2024, with the remaining RSUs vesting on February 14, 2026. The number of RSUs reflected on the table includes dividend equivalents applied through December 31, 2021, which were reinvested as additional unvested RSUs that will vest based on the same vesting schedule as the RSUs to which they relate. (6)Represents PSUs issued under the 2020-2022 Performance Plan. Actual payout will be based on final performance against plan metrics, as modified on March 15, 2021, for the full cycle . The number of PSUs reflected on the table includes dividend equivalents applied on the target number of shares through December 31, 2021, which were reinvested as additional unvested PSUs that will vest on the same basis as the underlying PSUs to which they relate. (7)A portion of these RSUs vested on February 26, 2021. The remaining RSUs will vest 49% on February 26, 2023 and 51% on February 26, 2025. The number of RSUs reflected on the table includes dividend equivalents applied through December 31, 2021, which were reinvested as additional RSUs that will vest based on the same vesting schedule as the RSUs to which they relate. (8)Represents PSUs issued under the 2019-2021 Performance Plan based on final MDCC approved payout for the full three-year cycle. The number of PSUs reflected on the table includes dividend equivalents applied on the target number of shares through December 31, 2021, which were reinvested as additional unvested PSUs that will vest on the same basis as the underlying PSUs to which they relate. (9)A portion of these RSUs vested on February 27, 2020. The remaining RSUs will vest 49% on February 27, 2022, and 51% February 27, 2024. The number of RSUs reflected here include dividend equivalents applied through December 31, 2021, which were reinvested as additional RSUs that will vest based on the same vesting schedule as the RSUs to which they relate. (10)Represents Performance RSUs which achieved a 200% payout percentage based on Honeywell’s TSR performance relative to the Compensation Peer Group over a three-year period of August 1, 2016–July 31, 2019. A portion of these RSUs vested in July 2019 and July 2021. The remaining RSUs will vest on July 31, 2023. The number of Performance RSUs reflected here includes dividend equivalents applied through December 31, 2021, which were reinvested as additional unvested Performance RSUs that will be adjusted and vest on the same basis as the underlying Performance RSUs to which they relate. (11)A portion of these RSUs vested on October 3, 2019 and October 3, 2021. The remaining RSUs will vest on October 3, 2023. The number of RSUs reflected here includes dividend equivalents applied through December 31, 2021, which were reinvested as additional unvested RSUs that will vest based on the same vesting schedule as the RSUs to which they relate. (12)A portion of these RSUs vested on July 31, 2018, and July 31, 2020. The remaining RSUs will vest July 31, 2022. The number of RSUs reflected here includes dividend equivalents applied through December 31, 2021, which were reinvested as additional unvested RSUs that will vest based on the same vesting schedule as the RSUs to which they relate. (13)A portion of these RSUs vested on July 26, 2019 and July 26, 2021. The remaining RSUs will vest on July 26, 2023. The number of RSUs reflected here includes dividend equivalents applied through December 31, 2021, which were reinvested as additional unvested RSUs that will vest based on the same vesting schedule as the RSUs to which they relate. (14)A portion of these RSUs vested on December 26, 2019 and December 26, 2021. The remaining RSUs will vest on December 26, 2023. The number of RSUs reflected here includes dividend equivalents applied through December 31, 2021, which were reinvested as additional unvested RSUs that will vest based on the same vesting schedule as the RSUs to which they relate. (15)50% of these RSUs vested on January 17, 2020, and the remaining RSUs vested on January 17, 2022. The number of RSUs reflected here includes dividend equivalents applied through December 31, 2021, which were reinvested as additional RSUs that vested based on the same vesting schedule as the RSUs to which they relate. (16)These RSUs will vest 100% on February 27, 2022. The number of RSUs reflected here includes dividend equivalents applied through December 31, 2021, which were reinvested as additional unvested RSUs that will vest based on the same vesting schedule as the RSUs to which they relate. (17)A portion of these RSUs vested on July 25, 2021. The remaining RSUs will vest 49% on July 25, 2023, and 51% July 25, 2025. The number of RSUs reflected here include dividend equivalents applied through December 31, 2021, which were reinvested as additional RSUs that will vest based on the same vesting schedule as the RSUs to which they relate. (18)A portion of these RSUs vested on July 27, 2019 and July 27, 2021. The remaining RSUs will vest on July 27, 2023. The number of RSUs reflected here includes dividend equivalents applied through December 31, 2021, which were reinvested as additional unvested RSUs that will vest based on the same vesting schedule as the RSUs to which they relate. (19)A portion of these RSUs vested on July 29, 2019 and July 29, 2021. The remaining RSUs will vest on July 29, 2023. The number of RSUs reflected here includes dividend equivalents applied through December 31, 2021, which were reinvested as additional unvested RSUs that will vest based on the same vesting schedule as the RSUs to which they relate. (20)Ms. Dallara will forfeit all outstanding equity awards that are unvested as of May 1, 2022, the effective date of her resignation.
| | | | | | | | | | 82 | | 07 Notice and Proxy Statement | 2022
| | EXECUTIVE
COMPENSATION TABLES
|
I
EXECUTIVE COMPENSATION TABLES OPTION EXERCISES AND STOCK VESTED—FISCAL YEAR 2020 | | | | | | | | | | | | | | | | | | | | | | | | | | | | | | | | | | | | | | | | | | | | | | Option Awards | | | | | | Stock Awards | | | | | | | | | | | | | | | | | | | | | | | | | | | | | | | | | | | | | | | | | | | | Named Executive Officer | | Number of Shares Acquired on Exercise(1) | | | Value Realized on Exercise(2) | | | | | | Number of Shares Acquired on Vesting(3) | | | Value Realized on Vesting(4) | | | | | | | | | | | | | | | | | | | | | | | | Darius Adamczyk | | | 97,162 | (5) | | $ | 10,436,851 | | | | | | | | 93,375 | (6) | | $ | 15,539,920 | | Gregory P. Lewis | | | 3,675 | (7) | | $ | 342,987 | | | | | | | | 9,984 | (8) | | $ | 1,450,294 | | Anne T. Madden | | | 21,007 | (9) | | $ | 2,010,782 | | | | | | | | 10,025 | (10) | | $ | 1,554,863 | | Rajeev Gautam | | | — | | | | — | | | | | | | | 26,478 | (11) | | $ | 4,405,971 | | John F. Waldron | | | — | | | | — | | | | | | | | 24,256 | (12) | | $ | 4,090,097 | |
| | | | | | | | | | | | | | | | | | | | | | | | | | | | | | | Option Awards | | Stock Awards | | Named Executive Officer | Number of Shares Acquired on Exercise(1) | | Value Realized on Exercise(2) | | Number of Shares Acquired on Vesting(3) | Value Realized on Vesting(4) | | Mr. Adamczyk | 42,015 | | (5) | | $ | 6,953,609 | | | 103,174 | | (6) | | $ | 22,207,274 | | | Mr. Lewis | 12,602 | | (7) | | $ | 2,154,768 | | | 7,011 | | (8) | | $ | 1,453,829 | | | Ms. Madden | 21,007 | | (9) | | $ | 3,293,856 | | | 19,962 | | (10) | | $ | 4,234,626 | | | Ms. Dallara | — | | | | — | | | 14,433 | | (11) | | $ | 3,000,203 | | | Mr. Madsen | — | | | | — | | | 10,377 | | (12) | | $ | 2,294,689 | |
(1)Represents the total number of stock options exercised during 2021 before the sale of option shares to cover the option exercise price, transaction costs and applicable taxes. (2)Represents “in the money” value of stock options at exercise calculated as: the difference between the market price at exercise and the exercise price, multiplied by the total number of options exercised. The individual totals may include multiple exercise transactions during the year. Under Honeywell’s Stock Ownership Guidelines, an officer must hold after-tax net gain shares from an options exercise for at least one year before they can be sold (waived upon retirement). (3)Represents the total number of RSUs and PSUs that vested during 2021 before share withholding for taxes and transaction costs. (4)Represents the total value of RSUs and PSUs at the vesting date calculated at the average of the high and low share price of one share of common stock on the day of vesting multiplied by the total number of units that vested. The individual totals may include multiple vesting transactions during the year. Under Honeywell’s Stock Ownership Guidelines, an officer must hold after-tax net shares from an RSU and PSU vesting for at least one year before they can be sold (waived upon retirement). (5)Relates to stock options originally granted in February 2013 with a ten-year term that would have expired in 2023 if not exercised. In connection with the stock option exercise, shares were withheld to cover the exercise price and the applicable taxes due upon exercise with Mr. Adamczyk receiving a total of 16,565 net gain shares. Net gain shares must be held at least one year before they can be sold. (6)Upon the vesting of RSUs, after withholding shares to cover applicable taxes, a total of 18,929 net shares were retained. Upon the vesting of PSUs, 34,469 shares were settled in cash, and 19,061 net shares were retained after withholding shares to cover applicable taxes. Net shares must be held at least one year before they can be sold. (7)Relates to stock options originally granted in February 2012 and February 2013 with a ten-year term that would have expired in 2022 and 2023 respectively if not exercised. In connection with the stock option exercises, shares were withheld to cover the exercise price and the applicable taxes due upon exercise with Mr. Lewis receiving a total of 5,011 net gain shares. Net gain shares must be held at least one year before they can be sold. (8)After withholding shares to cover applicable taxes and fees due upon the vesting of RSUs, a total of 3,875 net shares were retained. Net shares must be held at least one year before they can be sold. (9)Relates to stock options originally granted in February 2013 with a ten-year term that would have expired in 2023 if not exercised. In connection with the stock option exercise, shares were withheld to cover the exercise price and the applicable taxes due upon exercise with Ms. Madden receiving a total of 8,146 net gain shares. Net gain shares must be held at least one year before they can be sold. (10)Upon the vesting of RSUs, after withholding shares to cover applicable taxes, a total of 2,336 net shares were retained. Upon the vesting of PSUs, 7,866 shares were settled in cash, and 4,350 net shares were retained after withholding shares to cover applicable taxes. Net shares must be held at least one year before they can be sold. (11)Upon the vesting of RSUs, after withholding shares to cover applicable taxes, a total of 1,905 net shares were retained. Upon the vesting of PSUs, 5,479 shares were settled in cash, and 3,008 net shares were retained after withholding shares to cover applicable taxes. Net shares must be held at least one year before they can be sold. (12)After withholding shares to cover applicable taxes and fees due upon the vesting of RSUs, a total of 5,771 net shares were retained. Net shares must be held at least one year before they can be sold.
(1) | Represents the total number of stock options exercised during 2020 before the sale of option shares to cover the option exercise price, transaction costs
| | | | | | | | | | | | Notice and applicable taxes.Proxy Statement | 2022 | | 83 |
(2) | Represents “in the money” value of stock options at exercise calculated as: the difference between the market price at exercise and the exercise price, multiplied by the total number of options exercised. The individual totals may include multiple exercise transactions during the year. Under Honeywell’s Stock Ownership Guidelines, an officer must hold after-tax net gain shares from an options exercise for at least one year before they can be sold (waived upon retirement).
|
(3) | Represents the total number of RSUs and PSUs that vested during 2020 before share withholding for taxes and transaction costs.
|
(4) | Represents the total value of RSUs and PSUs at the vesting date calculated at the average of the high and low share price of one share of common stock on the day of vesting multiplied by the total number of units that vested. The individual totals may include multiple vesting transactions during the year. Under Honeywell’s Stock Ownership Guidelines, an officer must hold after-tax net shares from an RSU and PSU vesting for at least one year before they can be sold (waived upon retirement).
|
(5) | Relates to stock options originally granted in February 2012 with a ten-year term that would have expired in 2022 if not exercised. In connection with the stock option exercise, shares were withheld to cover the exercise price and the applicable taxes due upon exercise with Mr. Adamczyk receiving a total of 34,550 net gain shares. Net gain shares must be held at least one year before they can be sold.
|
(6) | Upon the vesting of RSUs, after withholding shares to cover applicable taxes, a total of 4,046 net shares were retained. Upon the vesting of PSUs, 43,028 shares were settled in cash, and 23,794 net shares were retained after withholding shares to cover applicable taxes. Net shares must be held at least one year before they can be sold.
|
(7) | Relates to stock options originally granted in February 2011 with a ten-year term that would have expired in 2021 if not exercised. In connection with the stock option exercise, shares were withheld to cover the exercise price and the applicable taxes due upon exercise with Mr. Lewis receiving a total of 1,275 net gain shares. Net gain shares must be held at least one year before they can be sold.
|
(8) | After withholding shares to cover applicable taxes and fees due upon the vesting of RSUs, Mr. Lewis retained a total of 5,446 net shares. Net shares must be held at least one year before they can be sold.
|
(9) | Relates to stock options originally granted in February 2012 with a ten-year term that would have expired in 2022 if not exercised. In connection with the stock option exercise, shares were withheld to cover the exercise price and the applicable taxes due upon exercise with Ms. Madden receiving a total of 7,257 net gain shares. Net gain shares must be held at least one year before they can be sold.
|
(10) | After withholding shares to cover applicable taxes and fees due upon the vesting of RSUs, Ms. Madden retained a total of 5,541 net shares. Net shares must be held at least one year before they can be sold.
|
(11) | Upon the vesting of RSUs, after withholding shares to cover applicable taxes, a total of 1,098 net shares were retained. Upon the vesting of PSUs, 12,114 shares were settled in cash, and 5,918 net shares were retained after withholding shares to cover applicable taxes. Net shares must be held at least one year before they can be sold.
|
(12) | Upon the vesting of RSUs, after withholding shares to cover applicable taxes, a total of 3,831 net shares were retained. Upon the vesting of PSUs, 8,590 shares were settled in cash, and 4,604 net shares were retained after withholding shares to cover applicable taxes. Net shares must be held at least one year before they can be sold.
|
I
EXECUTIVE COMPENSATION TABLES The following table provides summary information about the pension benefits that have been earned by the Company’s Named Executive Officers under two pension plans, the Honeywell International Inc. Supplemental Executive Retirement Plan (SERP) and the Honeywell International Inc. Retirement Earnings Plan (REP). Pension Benefits—Fiscal Year 2020 | | | | | | | | | | | | | | | | | | | | | | | | | | | Named Executive Officer | | Plan Name | | Number of Years
of Credited Service | | | Present Value of
Accumulated Benefits(1) | | | | | | | | | | | | | | Darius Adamczyk | | REP | | | 8.7 | | | $ | 143,438 | | | | SERP | | | 12.5 | | | $ | 3,029,101 | | | | | Total | | | | | | $ | 3,172,539 | | Gregory P. Lewis | | REP | | | 14.0 | | | $ | 231,813 | | | | SERP | | | 14.0 | | | $ | 727,682 | | | | | Total | | | | | | $ | 959,495 | | Anne T. Madden | | REP | | | 24.5 | | | $ | 404,951 | | | | SERP | | | 24.5 | | | $ | 1,560,673 | | | | | Total | | | | | | $ | 1,965,624 | | Rajeev Gautam | | REP | | | 42.3 | | | $ | 2,040,231 | | | | SERP | | | 42.3 | | | $ | 5,989,340 | | | | | Total | | | | | | $ | 8,029,571 | | John F. Waldron | | REP | | | 15.8 | | | $ | 260,609 | | | | SERP | | | 15.8 | | | $ | 935,835 | | | | | Total | | | | | | $ | 1,196,444 | |
(1) | The present value of the accumulated retirement benefit for each Named Executive Officer is calculated using a 2.50% discount rate, the projected PRI-2012 mortality table using scale MP-2020 and an immediate retirement age for Mr. Gautam and age 65 for the other Named Executive Officers, the earliest ages at which the Named Executive Officer can retire without an early retirement benefit reduction.
|
2021 | | | | | | | | | | | | | | | | Named Executive Officer | Plan Name | Number of
Years of
Credited
Service | Present Value of Accumulated Benefits(1) | | Darius Adamczyk | REP | 9.7 | | $ | 162,846 | | | SERP | 13.5 | | $ | 3,615,436 | | | Total | | | $ | 3,778,282 | | | Gregory P. Lewis | REP | 15 | | $ | 252,828 | | | SERP | 15 | | $ | 921,009 | | | Total | | | $ | 1,173,837 | | | Anne T. Madden | REP | 25.5 | | $ | 429,114 | | | SERP | 25.5 | | $ | 1,868,023 | | | Total | | | $ | 2,297,137 | | | Que Thanh Dallara | REP | 0 | | $ | — | | | SERP | 0 | | $ | — | | | Total | | | $ | — | | | Michael R. Madsen | REP | 35.6 | | $ | 1,890,262 | | | SERP | 35.6 | | $ | 2,661,942 | | | Total | | | $ | 4,552,204 | |
| | | | | | | | | 75
| |
| | | |(1)The present value of the accumulated retirement benefit for each Named Executive Officer is calculated using a 2.87% discount rate, the projected PRI-2012 mortality table, and with a retirement of age 62 for Mr. Madsen and age 65 for the other Named Executive Officers (the earliest ages at which the Named Executive Officer can retire without an early retirement benefit reduction). Notice and Proxy Statement | 2021
| | | |
| | | 07 | | | EXECUTIVE
COMPENSATION TABLES
|
The SERP and REP benefits depend on the length of each Named Executive Officer’s employment with Honeywell (and companies that have been acquired by Honeywell). This information is provided in the table above under the column titled “Number of Years of Credited Service.” The column in the table above titled “Present Value of Accumulated Benefits” represents a financial calculation that estimates the cash value today of the full pension benefit that has been earned by each Named Executive Officer. It is based on various assumptions, including assumptions about how long each Named Executive Officer will live and future interest rates. Additional details about the pension benefits for each Named Executive Officer include: •The REP is a tax-qualified pension plan in which a significant portion of Honeywell’s U.S. employees participate. •The REP complies with tax requirements applicable to broad-based pension plans, which impose dollar limits on the amount of benefits that can be provided. As a result, the pensions that can be paid under the REP for higher-paid employees represent a much smaller fraction of current income than the pensions that can be paid to less highly paid employees. We make up for this difference, in part, by providing supplemental pensions through the SERP. •All SERP benefits will be paid on the first day of the first month that begins following the 105th day after the later of the officer’s separation from service (as that term is defined in Internal Revenue Code Section 409A) or his or her earliest retirement date. Pension Benefit Calculation Formulas
•Ms. Dallara does not participate in the REP or the SERP and is not eligible to receive a pension benefit from Honeywell.
| | | | | | | | | | 84 | | Notice and Proxy Statement | 2022 |
EXECUTIVE COMPENSATION TABLES PENSION BENEFIT CALCULATION FORMULAS Within the REP and the SERP, a variety of formulas are used to determine pension benefits. Different benefit formulas apply for different groups of employees for historical reasons. Generally, as Honeywell has grown through acquisitions, the Company has in many cases retained the benefit formulas under pension plans that were maintained by the companies acquired, in order to provide continuity for employees. The differences in the benefit formulas for our Named Executive Officers reflect this history. The explanation below describes the formulas that are used to determine the amount of pension benefits for each of the Company’s Named Executive Officers (NEOs) under the REP and the SERP. | | | | | | | | | Name of Formula | | Benefit Calculation | | REP | | | REP
| | •Lump sum equal to (1) 6% of final average compensation (annual average compensation for the five calendar years out of the previous 10 calendar years that produces highest average) times (2) credited service. | | ALLIED SALARIED | | | UOP
| | • Annual amount in singleSingle life annuity at age 65 equal to the greater(1)(A) 2% of (1) and (2), minus (3), where: (1) is 1.2%final average compensation (average of average final compensation (base salary and shift differential for the 3660 consecutive calendar months out of the previousprior 120 consecutive calendar months that produce theproduces highest average) times (B) credited service plus $144,(up to 25 years), minus (2) is 1.5% of average final compensation (base salary, shift differential, overtime, sales commissions, sales bonuses, annual incentive compensation for the 36 consecutive calendar months out of the previous 120 consecutive calendar months that produce the highest average) times credited service, minus 1.5%64% of estimated Social Security benefit times credited service (to a maximum of 50%), and (3) is any benefits payable under the Union Carbide Corporation Retirement Program.•benefits. The final average final compensation componentscomponent of the formula werewas frozen and no amounts earned or paid after December 31, 2015 will be included, except that the annual incentive compensation paid in 2016 waswill be included in 2015 compensation.
| | SIGNAL | •Single life annuity equal to (1)(A) 1.5% of final average compensation (average of compensation for purposesthe 60 consecutive months out of the last 120 that produces the highest average) times (B) credited service (with no limit on service) minus (2) above.(A) 1.5% of estimated Social Security times (B) credited service up to 33 1/3 years. The final average compensation component of the formula was frozen and no amounts earned or paid after December 31, 2015 will be included, except that the annual incentive compensation paid in 2016 will be included in 2015 compensation. |
For each pension benefit calculation formula listed in the REP formulachart above, compensation includes base salary,pay, short-term incentive compensation, payroll-based rewards and recognition and lump sum incentives. Calculations for pension formulas other than the UOPREP formula include the annual incentive compensation in the year earned while theearned. The REP formula includes annual incentive compensation in the year paid. The amount of compensation taken into account under the REP is limited by tax rules, but the amount of compensation taken into account under the SERP is not. The 2015 compensation change described above also applies to the compensation taken into account under the SERP. The benefit formulas above describe the pension benefits in terms of a lump sum cash payment (for the REP formula) or a single life annuity (for the UOP formula)other formulas). Participants are entitled to receive their benefits in other payment forms, including, for example joint and survivor annuities, period certain annuities and level income payments. However, the value of each available payment form is the same. Based on SERP terms, Mr. GautamMadsen will receive his SERP benefits in the form of an annuity.a lump sum. The UOPAllied Salaried formula also provides for early retirement benefits. A participant is eligible for early retirement if the participant's age and years of service equal or exceed 60 and the participant has attainedattached age 50 with at least tenfive years of vesting service.service or if the participant's age and years of service equal or exceed 80 regardless of the participant's age. If the participant retires early, his accruedthe participant's benefit (other thanat normal retirement age is reduced by 1/4 of 1% for each month payments begin before age 62 (3% per year). In addition, the Social Security offset portion)benefit reduction portion of the formula is reduced by 0.33%1/180 for each month benefits are paid between ages 60 and 65, and 1/360 for each month benefits are paid before the participant’sparticipant's 60th birthday (4% per year).birthday. | | | | |
| | | Notice and Proxy Statement | 2021
| | 76
|
| | | 07 | | | EXECUTIVE
COMPENSATION TABLES
|
As stated above, the pension formula used to determine the amount of pension benefits under each of the plans for our Named Executive Officers (NEO)NEOs differs for historical reasons. Also, additional contractual pension benefits have been provided to certain Named Executive Officers as deemed necessary and appropriate at the time of their recruitment to the Company or to retain the executive. The table below describes which formulas are applicable to each of our NEOs. | | | | | | | | | Name/Formula | | Description of Total Pension Benefits | | | | Darius Adamczyk
Total pension benefit = REP
formula benefits | | •Mr. Adamczyk’s pension benefits under the REP and the SERP are determined under the REP formula, with the SERP benefit calculated using all his Honeywell employment as credited service. | Gregory P. Lewis
Total pension benefit = REP
formula benefits | | | | Gregory P. Lewis
| | •Mr. Lewis’ pension benefits under the REP and the SERP are determined under the REP formula. | Anne T. Madden
Total pension benefit = REP
formula benefits | | | | Anne T. Madden
Total pension benefit = REP formula benefits
| | •Ms. Madden’s pension benefits under the REP and the SERP are determined under the REP formula. | | | | Rajeev Gautam
Michael R. Madsen
Total pension benefit = UOPAllied Salaried formula benefits | | •Mr. GautamMadsen is currently eligible for early retirement benefits payable under the UOPAllied Salaried formula. TheDue to subsidized early retirement, the value of his benefit payable on December 31, 2020, equals2021 exceeds the benefit shown in the table above. | | | | John F. Waldron
Total pension benefit = REP formula benefits
| | •above by $749,413. A portion of Mr. Waldron’sMadsen's pension benefits under the REP and thea portion of his SERP benefits are determined under the REPSignal formula.
| | | These amounts are part of, not in addition to, his Allied Salaried formula benefits. |
| | | | | | | | | | | | 77
| |
| | | |Notice and Proxy Statement | 2021 2022
| | | 85 |
EXECUTIVE COMPENSATION TABLES
| | | 07 | | | EXECUTIVE
COMPENSATION TABLES
|
INONQUALIFIED DEFERRED COMPENSATION—FISCAL YEAR 2020
Since 2005, 2021
Honeywell has taken steps to limitlimits deferred compensation amounts owed to executives by reducing the overall interest rate earned on new deferrals and accelerating the payout of deferred amounts, thereby limiting the period over which interest is earned. These include changinghaving the interest rate accruing on new deferrals under the Honeywell Excess Benefit Plan and Honeywell Supplemental Savings Plan (the SS Plan) and the Honeywell Deferred Incentive Plan (the DIC Plan) from a fixed above-market rate tobe a rate that changes annually based on the Company’s 15-year cost of borrowing;borrowing and requiring payment of the SS Plan or DIC Plan deferrals to begin shortly after termination of employment in a lump sum unless the participant leaves the Company after reaching retirement (age 55 with 10 years of service). In addition, cash dividend equivalents on vested deferred RSUs cannot be deferred and dividend equivalents on unvested RSUs are reinvested in additional RSUs and subject to the same vesting schedule as the underlying RSUs. | | | | | | | | | | | | | | | | | | | | | | | | | | | | | | | | | | | | | | | | | | | | | | | Named Executive Officer | | Plan | | Executive
Contributions
in Last FY(3) | | | Registrant
Contributions
in Last FY(1) (3) | | | Aggregate
Earnings
in Last FY(3) | | | Aggregate
Withdrawals/
Distributions | | | Aggregate
Balance at
Last FYE(3) | | | | | | | | | | | | | | | | | | | | | | | | | | Darius Adamczyk | | SS Plan(1) | | $ | 105,792 | | | $ | 92,568 | | | $ | 163,667 | | | | — | | | $ | 1,524,079 | | | | DIC Plan | | $ | 813,000 | | | | — | | | $ | 31,083 | | | | — | | | $ | 1,268,939 | | | | Deferred RSUs(2) | | | — | | | | — | | | | — | | | | — | | | | — | | | | | Total | | $ | 918,792 | | | $ | 92,568 | | | $ | 194,750 | | | | — | | | $ | 2,793,018 | | Gregory P. Lewis | | SS Plan(1) | | $ | 113,858 | | | $ | 32,810 | | | $ | 46,670 | | | | — | | | $ | 641,580 | | | | DIC Plan | | | — | | | | — | | | $ | 3,210 | | | | — | | | $ | 119,440 | | | | Deferred RSUs(2) | | | — | | | | — | | | | — | | | | — | | | | — | | | | | Total | | $ | 113,858 | | | $ | 32,810 | | | $ | 49,880 | | | | — | | | $ | 761,020 | | Anne T. Madden | | SS Plan(1) | | $ | 246,057 | | | $ | 37,837 | | | $ | 299,621 | | | | — | | | $ | 3,501,043 | | | | DIC Plan | | $ | 1,102,000 | | | | — | | | $ | 150,636 | | | | — | | | $ | 5,757,602 | | | | Deferred RSUs(2) | | | — | | | | — | | | $ | 1,328,624 | | | | — | | | $ | 7,726,615 | | | | | Total | | $ | 1,348,057 | | | $ | 37,837 | | | $ | 1,778,881 | | | | — | | | $ | 16,985,260 | | Rajeev Gautam | | SS Plan(1) | | $ | 41,972 | | | $ | 33,838 | | | $ | 153,231 | | | | — | | | $ | 2,332,295 | | | | DIC Plan | | | — | | | | — | | | $ | 16,760 | | | | — | | | $ | 623,673 | | | | Deferred RSUs(2) | | | — | | | | — | | | | — | | | | — | | | | — | | | | | Total | | $ | 41,972 | | | $ | 33,838 | | | $ | 169,991 | | | | — | | | $ | 2,955,968 | | John F. Waldron | | SS Plan(1) | | $ | 71,040 | | | $ | 29,384 | | | $ | 39,364 | | | | — | | | $ | 531,852 | | | | DIC Plan | | | — | | | | — | | | | — | | | | — | | | | — | | | | Deferred RSUs(2) | | | — | | | | — | | | | — | | | | — | | | | — | | | | | Total | | $ | 71,040 | | | $ | 29,384 | | | $ | 39,364 | | | | — | | | $ | 531,852 | |
| | | | | | | | | | | | | | | | | | | | | | | | | | | | | | | | | Named Executive
Officer | Plan | Executive Contributions in Last FY(3) | Registrant Contributions in Last FY(1)(3) | Aggregate Earnings in Last FY(3) | Aggregate
Withdrawals/
Distributions | Aggregate Balance at Last FYE(3) | | Darius Adamczyk | SS Plan(1) | | $ | 114,438 | | | $ | 100,134 | | | $ | 14,217 | | — | | $ | 1,745,827 | | | DIC Plan | | $ | — | | | — | | | $ | 21,783 | | — | | $ | 1,291,629 | | | Deferred RSUs(2) | | — | | | — | | | — | | — | | — | | | Total | | $ | 114,438 | | | $ | 100,134 | | | $ | 36,000 | | — | | $ | 3,037,456 | | | Gregory P. Lewis | SS Plan(1) | | $ | 127,600 | | | $ | 37,757 | | | $ | 9,029 | | — | | $ | 811,336 | | | DIC Plan | | — | | | — | | | $ | 2,054 | | — | | $ | 121,579 | | | Deferred RSUs(2) | | — | | | — | | | — | | — | | — | | | Total | | $ | 127,600 | | | $ | 37,757 | | | $ | 11,083 | | — | | $ | 932,915 | | | Anne T. Madden | SS Plan(1) | | $ | 260,695 | | | $ | 40,533 | | | $ | 85,930 | | — | | $ | 3,886,846 | | | DIC Plan | | $ | 758,000 | | | — | | | $ | 110,553 | | — | | $ | 6,630,274 | | | Deferred RSUs(2) | | — | | | — | | | $ | (42,263) | | — | | $ | 7,684,352 | | | Total | | $ | 1,018,695 | | | $ | 40,533 | | | $ | 154,220 | | — | | $ | 18,201,472 | | | Que Thanh Dallara | SS Plan(1) | | $ | 99,930 | | | 30,256 | | | $ | 6,799 | | — | | $ | 515,323 | | | DIC Plan | | 55,600 | | | — | | | $ | 4,855 | | — | | $ | 294,014 | | | Deferred RSUs(2) | | — | | | — | | | — | | — | | — | | | Total | | $ | 155,530 | | | $ | 30,256 | | | $ | 11,654 | | — | | $ | 809,337 | | | Michael R. Madsen | SS Plan(1) | | $ | 39,410 | | | $ | 31,246 | | | $ | 10,479 | | — | | $ | 912,932 | | | DIC Plan | | — | | | — | | | — | | — | | — | | | Deferred RSUs(2) | | — | | | — | | | — | | — | | — | | | Total | | $ | 39,410 | | | $ | 31,246 | | | $ | 10,479 | | — | | $ | 912,932 | |
All deferred compensation amounts, regardless of the plan, are unfunded and unsecured obligations of the Company and are subject to the same risks as any of the Company’s general obligations. (1)For SS Plan deferrals, the Company matching contributions are credited annually no later than the following January 31st if the Named Executive Officer was actively employed or on a disability leave of absence as of December 15th. The value of registrant contributions in the last fiscal year for the SS Plan includes annual matching contributions that were credited to the Named Executive Officers in January 2022 for the 2021 year. (2)The value of executive contributions in the last fiscal year is calculated by multiplying the number of deferred RSUs that vested in 2021 by the closing price of a share of common stock on the vesting date (or the next business day following the vesting date). The value of the aggregate balance at the last fiscal year is calculated by multiplying the total number of vested, deferred RSUs on December 31, 2021, by the closing price of a share of common stock on December 31, 2021 ($208.51). This column reflects the following: 34,716 units including dividend reinvestment units and $445,628 in cash for Ms. Madden. (3)The following table details the extent to which amounts reported in the contributions and earnings columns are reported in the Summary Compensation Table and amounts reported in the aggregate balance column were reported in the Summary Compensation Table for previous years. In the table above, for the SS Plan, the Aggregate Earnings in Last FY column includes interest credits and changes in the value of the Company Common Stock Fund. The value of the Company Common Stock Fund increases or decreases in accordance with the Company’s stock price and the reinvestment of dividends. In the table above, for the deferred RSUs, the Aggregate Earnings in Last FY column includes dividend equivalent credits and any increase (or decrease) in the Company’s stock price. | | | | | | | | | | | | | | | | | | | | | | | | | | | | Named Executive Officer | Executive
Contributions in SCT | Registrant
Contributions in SCT | Earnings in SCT | Portion of Aggregate
Balance Included in
Prior SCTs | | Darius Adamczyk | | $ | 114,438 | | | $ | 100,134 | | | $ | 2,489 | | | $ | 2,126,264 | | | Gregory P. Lewis | | $ | 127,600 | | | $ | 37,757 | | | $ | 747 | | | $ | 338,075 | | | Anne T. Madden | | $ | 260,695 | | | $ | 40,533 | | | $ | 57,507 | | | $ | 2,469,873 | | | Que Thanh Dallara | | $ | 99,930 | | | $ | 30,256 | | | $ | 773 | | | $ | 0 | | | Michael R. Madsen | | $ | 39,410 | | | $ | 31,246 | | | $ | 726 | | | $ | 0 | |
(1) | For SS Plan deferrals, the Company matching contributions are credited annually no later than the following January 31st if the Named Executive Officer was actively employed or on a disability leave of absence as of December 15th. The value of registrant contributions in the last fiscal year for the SS Plan includes annual matching contributions that were credited to the Named Executive Officers in January 2021 for the 2020 year.
|
(2) | The value of executive contributions in the last fiscal year is calculated by multiplying the number of deferred RSUs that vested in 2020 by the closing price of a share of common stock on the vesting date (or the next business day following the vesting date). The value of the aggregate balance at the last fiscal year is calculated by multiplying the total number of vested, deferred RSUs on December 31, 2020, by the closing price of a share of common stock on December 31, 2020 ($212.70). This column reflects the following: 34,527 units including dividend reinvestment units and $382,662 in cash for Ms. Madden.
|
(3) | The following table details the extent to which amounts reported in the contributions and earnings columns are reported in the Summary Compensation Table and amounts reported in the aggregate balance column were reported in the Summary Compensation Table for previous years. In the table above, for the SS Plan, the Aggregate Earnings in Last FY column includes interest credits and changes in the value of the Company Common Stock Fund. The value of the Company Common Stock Fund increases or decreases in accordance with the Company’s stock price and the reinvestment of dividends. In the table above, for the deferred RSUs, the Aggregate Earnings in Last FY column includes dividend equivalent credits and any increase (or decrease) in the Company’s stock price.
|
| | | | | | | | | | | | | | | | | | | | | | | | | | | | | | | | | | | | | | | | | | | | | | | | | | | | | | | | | | | | | | | | | | | | | | | | | | | | | | | | | | | | | | | | | | | Named Executive Officer | | Executive
Contributions in SCT | | | Registrant
Contributions in SCT | | | Earnings in SCT | | | Portion of Aggregate
Balance Included in Prior SCTs | | | | | | | | | | | | | | | | | | | | | | | | | | | | | | | | | | | | | | | | | | | | | | | | | | | | | | | | | | | | | | | | | | | | | Darius Adamczyk | | | $105,792 | | | | $92,568 | | | | $ 5,348 | | | | $1,922,556 | | | | | | | | | | | | | | | | | | | | | | | | | | | | | | Gregory P. Lewis | | | $113,858 | | | | $32,810 | | | | $ 1,454 | | | | $ 189,953 | | | | | | | | | | | | | | | | | | | | | | | | | | | | | | Anne T. Madden | | | $246,057 | | | | $37,837 | | | | $38,557 | | | | $1,389,422 | | | | | | | | | | | | | | | | | | | | | | | | | | | | | | Rajeev Gautam | | | $ 41,972 | | | | $33,838 | | | | $ 6,880 | | | | $ 333,245 | | | | | | | | | | | | | | | | | | | | | | | | | | | | | | John F. Waldron | | | $ 71,040 | | | | $29,384 | | | | $ 940 | | | | — | | | | | | | | | | | | | | | | | | | | | | | | | | | | | |
| | | | |
86 | | |Notice and Proxy Statement | 2021
| | 78
2022 |
EXECUTIVE COMPENSATION TABLES
| | | 07 | | | EXECUTIVE
COMPENSATION TABLES
|
Honeywell Excess Benefit Plan and Honeywell Supplemental Savings Plan
HONEYWELL EXCESS BENEFIT PLAN AND HONEYWELL SUPPLEMENTAL SAVINGS PLAN The Supplemental Savings Plan allows Honeywell executives, including the Named Executive Officers, to defer the portion of their annual base salary that cannot be contributed to the Company’s tax-qualified 401(k) plan due to the annual deferral and compensation limits imposed by the Internal Revenue Code and/or up to an additional 25% of base annual salary for the plan year. To the extent amounts have not already been matched on a similar basis under the Company’s 401(k) plan, Honeywell matched deferrals posted to the SS Plan at the rate of 87.5% on the first 8% of eligible pay. Matching contributions are always vested and are credited on an annual basis if the participant was actively employed or on a disability leave of absence as of December 15, 2020.2021. Interest Rate.Participant deferrals for the 2005 plan year and later are credited with a rate of interest, compounded daily, based on the Company’s 15-year cost of borrowing. The rate is subject to change annually, and for 2020,2021, this rate was 2.76%1.74%. Participant deferrals for the 2004 plan year and earlier are credited with a rate of interest, compounded daily, that was set by the Management Development and Compensation Committee (MDCC) before the beginning of each plan year and is fixed until the deferral is distributed. Prior to the 2005 plan year, the MDCC would set the rate at an above-market rate to retain executives. Above-market interest credited on SS Plan deferrals and reflected in the Summary Compensation Table on page 7078 includes the difference between market interest rates determined by SEC rules and the interest credited under the SS Plan. Matching contributions are treated as invested in common stock. Dividends are treated as reinvested in additional shares of common stock.
Distribution.Amounts deferred for the 2005 plan year and later will be distributed in a lump sum in January of the year following the termination of the participant’s active employment. For the 2020 plan year and later, a participant can elect to receive five, 10 or 15 installments in lieu of the lump sum payment, which election will take effect only if the participant terminates employment after reaching age 55 with 10 years of service; for the 2006 to 2019 plan years, a participant could elect up to ten installments under the same terms. Except in hardship circumstances, amounts deferred for the 2004 plan year and earlier will be distributed either in January of any subsequent year or in January of the year following termination of employment, as elected by the participant. The participant could elect to receive distributions in a lump sum or up to 15 annual installments. Participant deferrals to the SS Plan are distributed in cash only. Matching contributions are distributed in shares of common stock. Amounts deferred for the 2005 plan year and later cannot be withdrawn before the distribution date for any reason. Amounts deferred for the 2004 plan year and earlier may be withdrawn before the distribution date if a hardship exists or the participant requests an immediate withdrawal subject to a penalty of 6%. Honeywell Salary and Incentive Award Deferral Plan for Selected Employees
HONEYWELL SALARY AND INCENTIVE AWARD DEFERRAL PLAN FOR SELECTED EMPLOYEES The Honeywell DIC Plan allows Honeywell executives, including the Named Executive Officers, to defer all or a portion of their annual cash incentive compensation.
Interest Rate.Beginning in 2005, deferrals are credited with a rate of interest, based on Honeywell’s 15-year borrowing rate which is set annually at the beginning of the year (2.76%(1.74% for 2020)2021). Amounts deferred for the 2004 plan year and earlier are credited with a rate of interest, compounded daily, that was set by the MDCC before the beginning of each plan year and is fixed until the deferral is distributed. Prior to the 2005 plan year, the MDCC would set the total rate at an above-market rate to retain executives. Above-market interest credited on DIC Plan deferrals and reflected in the Summary Compensation Table on page 7078 includes the difference between market interest rates determined by SEC rules and the interest credited under the DIC Plan.Distribution.
Distribution. Amounts deferred for the 2006 plan year and later will be distributed in a lump sum in January of the year following the termination of the participant’s active employment. For the 2020 plan year and later, a participant can elect to receive five, 10 or 15 installments in lieu of the lump sum payment, which election will take effect only if the participant terminates employment after reaching age 55 with 10 years of service; for the 2006 to 2019 plan years, a participant could elect up to 10 installments under the same terms. Except in hardship circumstances (if permitted), amounts deferred for the 2005 plan year and earlier will be distributed either in January of any year three years after the compensation was earned or in January of the year following termination of the participant’s employment, as elected by the participant. The participant could elect to receive non-hardship distributions in a lump sum or up to 15 annual installments. | | | | | | | | | | | | | Notice and Proxy Statement | 2022 | | 87 |
EXECUTIVE COMPENSATION TABLES Amounts deferred for the 2002 plan year and later cannot be withdrawn before the distribution date for any reason. Amounts deferred for the 2001 plan year and earlier may be withdrawn before the distribution date if a hardship exists or the participant requests an immediate withdrawal subject to a penalty that ranges from 0% to 6% and that is based on the 10-year Treasury bond rate at the beginning of the calendar quarter. DEFERRAL OF RSUs | | | | | | | | | 79
| |
| | | | Notice and Proxy Statement | 2021
| | | |
| | | 07 | | | EXECUTIVE
COMPENSATION TABLES
|
Deferral of RSUs
The Named Executive Officers may defer the receipt of up to 100% of theircertain RSUs upon vesting based on an election made at the time of grant. The executive may defer payment to: •A specific year after the vesting year; or •The year following the executive’s termination of active employment. The executive can also choose to receive payment in a lump sum or up to 15 annual installments and can also elect at the time of grant to accelerate the form and timing of payment following a change in control to a lump sum paid no later than 90 days following the change in control. Cash dividend equivalents on deferred RSUs (determined at the same rate as a regular share of common stock) are converted to additional deferred RSUs as of the dividend payment date and are subject to the same payment schedule and restrictions as the underlying deferred RSUs. For grants made before July 2004, an executive could also defer dividend equivalents in cash and such amounts are credited with interest at a 10% rate, compounded daily, until payment. The practice of deferring dividend equivalents in cash ended in July 2004. Ms. Madden is the only NEO with legacy deferred RSU awards under these prior provisions. Above-market interest related to theMs. Madden's deferred RSU dividend equivalents reflected inis included on the Summary Compensation Table on page 70 includesas the difference between market interest rates determined by SEC rules and the 10% interest credited by the Company on theher pre-July 2004 grants, the terms of which cannot be amended. Unvested Dividend Equivalents
UNVESTED DIVIDEND EQUIVALENTS Cash dividend equivalents on unvested RSUs (determined at the same rate as a regular share of common stock) are converted to additional unvested RSUs as of the dividend payment date and are subject to the same vesting schedule and restrictions as the underlying RSUs. The terms of the SERP Plan, the SS Plan, the DIC Plan, the deferred RSUs and the unvested dividend equivalents are subject to the requirements of, and regulations and guidance published by, Section 409A of the Internal Revenue Code. I
POTENTIAL PAYMENTS UPON TERMINATION OR CHANGE IN CONTROL This section describes the benefits payable to our named executive officers (NEOs) in two circumstances: •Termination of Employment Senior Severance Plan
SENIOR SEVERANCE PLAN These benefits are determined primarily under a plan that we refer to as our Senior Severance Plan. In addition to the Senior Severance Plan, other of our benefits plans, such as our annual incentive compensation plan, also have provisions that impact these benefits. These benefits ensure that our executives are motivated primarily by the needs of the businesses for which they are responsible, rather than circumstances that are outside the ordinary course of business, i.e., circumstances that might lead to the termination of an executive’s employment or that might lead to a CIC of the Company. Generally, this is achieved by assuring our NEOs that they will receive a level of continued compensation if their employment is adversely affected in these circumstances, subject to certain conditions. We believe that these benefits help ensure that affected executives act in the best interests of our shareowners, even if such actions are otherwise contrary to their personal interests. This is critical because these are circumstances in which the actions of our NEOs may have a material impact upon our shareowners. Accordingly, we set the level and terms of these benefits in a way that we believe is necessary to obtain the desired results. The level of benefit and the rights to benefits are determined by the type of termination event, as described below. We believe that these benefits are generally in line with current market practices and are particularly important as we do not maintain employment agreements with our NEOs. Benefits provided under the Senior Severance Plan are conditioned on the executive executing a full release of claims and certain non-competition and non-solicitation covenants in favor of the Company. The right to continued severance benefits under the plan ceases in the event of a violation of such covenants. In addition, we would seek to recover severance benefits already paid to any executive who violates such restrictive covenants. | | | | | | | | | | 88 | | Notice and Proxy Statement | 2022 |
EXECUTIVE COMPENSATION TABLES In the case of a CIC, severance benefits are payable only if both parts of the “double trigger” are satisfied. That is, (i) there must be a CIC of our Company, and (ii)(A) the NEO must be involuntarily terminated other than for cause, or (ii)(B) the NEO must initiate the termination of his own employment for good reason. Similarly, the Company also amended its stock incentive plan in 2014 to eliminate automatic single-trigger vesting of all new equity and Performance Plan Unit awards that are rolled-over upon a CIC. SUMMARY OF BENEFITS—TERMINATION EVENTS | | | | |
| | | Notice and Proxy Statement | 2021
| | 80
|
| | | 07 | | | EXECUTIVE
COMPENSATION TABLES
|
Summary of Benefits—Termination Events
The following table summarizes the termination of employment and CIC benefits payable to our NEOs. None of these termination benefits are payable to NEOs who voluntarily quitresign (other than voluntary resignations for good reason after a CIC) or whose employment is terminated by us for cause. The information in the table below assumes, in each case, that termination of employment occurred on December 31, 2020.2021. Pension and nonqualifiednon-qualified deferred compensation benefits, which are described elsewhere in this Proxy Statement, are not included in the table below in accordance with applicable SEC rules, even though they may become payable upon the occurrence of the events specified in the table. The effect of a termination of employment or CIC on outstanding stock options, RSUs and PSUs is described in the section below entitled “Impact on Equity-Based Awards.” | | | | | | | | | | | | | | | | | | | | | | | | | | | | | | | | | | | | | | | | | | | | | | | Payments and Benefits | | Named Executive Officer | | Termination
by the Company
Without Cause | | | Death | | | Disability | | | Change in Control—
No Termination of
Employment | | | Change in Control—
Termination of
Employment by
Company Without
Cause, By NEO for
Good Reason or Due
to Disability | | | | | | | | | | | | | | | | | | | | | | | | | | Cash Severance (Base Salary + Bonus) | | Darius Adamczyk | | $ | 13,200,000 | | | | — | | | | — | | | | — | | | $ | 13,200,000 | | | | Gregory P. Lewis | | $ | 2,310,000 | | | | — | | | | — | | | | — | | | $ | 3,080,000 | | | | Anne T. Madden | | $ | 2,541,000 | | | | — | | | | — | | | | — | | | $ | 3,388,000 | | | | Rajeev Gautam | | $ | 2,355,000 | | | | — | | | | — | | | | — | | | $ | 3,140,000 | | | | | John F. Waldron | | $ | 2,160,000 | | | | — | | | | — | | | | — | | | $ | 2,880,000 | | ICP (Year of Termination) | | Darius Adamczyk | | | — | | | | — | | | | — | | | $ | 2,508,000 | | | $ | 2,508,000 | | | | Gregory P. Lewis | | | — | | | | — | | | | — | | | $ | 689,000 | | | $ | 689,000 | | | | Anne T. Madden | | | — | | | | — | | | | — | | | $ | 758,000 | | | $ | 758,000 | | | | Rajeev Gautam | | | — | | | | — | | | | — | | | $ | 503,000 | | | $ | 503,000 | | | | | John F. Waldron | | | — | | | | — | | | | — | | | $ | 908,000 | | | $ | 908,000 | | Performance Cash Units | | Darius Adamczyk | | | — | | | | — | | | | — | | | | — | | | | — | | | | Gregory P. Lewis | | | — | | | $ | 766,500 | | | $ | 766,500 | | | | — | | | $ | 766,500 | | | | Anne T. Madden | | | — | | | | — | | | | — | | | | — | | | | — | | | | Rajeev Gautam | | | — | | | | — | | | | — | | | | — | | | | — | | | | | John F. Waldron | | | — | | | | — | | | | — | | | | — | | | | — | | Benefits and Perquisites | | Darius Adamczyk | | $ | 29,664 | | | | — | | | | — | | | | — | | | $ | 29,664 | | | | Gregory P. Lewis | | $ | 12,132 | | | | — | | | | — | | | | — | | | $ | 16,176 | | | | Anne T. Madden | | $ | 14,346 | | | | — | | | | — | | | | — | | | $ | 19,128 | | | | Rajeev Gautam | | $ | 16,380 | | | | — | | | | — | | | | — | | | $ | 21,840 | | | | | John F. Waldron | | $ | 11,286 | | | | — | | | | — | | | | — | | | $ | 15,048 | | All Other-Payments/Benefits | | Darius Adamczyk | | $ | 144,104 | | | | — | | | | — | | | | — | | | $ | 144,104 | | | | Gregory P. Lewis | | $ | 185,619 | | | | — | | | | — | | | | — | | | $ | 185,619 | | | | Anne T. Madden | | $ | 284,833 | | | | — | | | | — | | | | — | | | $ | 549,152 | | | | Rajeev Gautam | | | — | | | | — | | | | — | | | | — | | | | — | | | | | John F. Waldron | | $ | 164,280 | | | | — | | | | — | | | | — | | | | — | | Total | | Darius Adamczyk | | $ | 13,373,768 | | | | — | | | | — | | | $ | 2,508,000 | | | $ | 15,881,768 | | | | Gregory P. Lewis | | $ | 2,507,751 | | | $ | 766,500 | | | $ | 766,500 | | | $ | 689,000 | | | $ | 4,737,295 | | | | Anne T. Madden | | $ | 2,840,179 | | | | — | | | | — | | | $ | 758,000 | | | $ | 4,714,280 | | | | Rajeev Gautam | | $ | 2,371,380 | | | | — | | | | — | | | $ | 503,000 | | | $ | 3,664,840 | | | | | John F. Waldron | | $ | 2,335,566 | | | | — | | | | — | | | $ | 908,000 | | | $ | 3,803,048 | |
| | | | | | | | | | | | | | | | | | | | | | | | | | | | | | | | | | | | | Payments and Benefits | Named Executive Officer | Termination by the Company Without Cause | | Death | | Disability | Change in Control—No Termination of Employment | Change in Control—Termination of Employment by Company Without Cause, By NEO for Good Reason or Due to Disability | Cash Severance
| Mr. Adamczyk | | $ | 14,025,000 | | | $ | — | | | $ | — | | | $ | — | | | $ | 14,025,000 | | | (Base Salary + Bonus) | Mr. Lewis | | $ | 2,550,000 | | | $ | — | | | $ | — | | | $ | — | | | $ | 3,400,000 | | | Ms. Madden | | $ | 2,603,100 | | | $ | — | | | $ | — | | | $ | — | | | $ | 3,470,800 | | | Ms. Dallara | | $ | 2,055,000 | | | $ | — | | | $ | — | | | $ | — | | | $ | 2,740,000 | | | Mr. Madsen | | $ | 2,247,000 | | | $ | — | | | $ | — | | | $ | — | | | $ | 2,996,000 | | | | | | | | | | | | | | | | | | | | | | | | | | ICP
| Mr. Adamczyk | | $ | — | | | $ | — | | | $ | — | | | $ | 3,910,000 | | | $ | 3,910,000 | | | (Year of Termination) | Mr. Lewis | | $ | — | | | $ | — | | | $ | — | | | $ | 1,107,000 | | | $ | 1,107,000 | | | Ms. Madden | | $ | — | | | $ | — | | | $ | — | | | $ | 1,159,000 | | | $ | 1,159,000 | | | Ms. Dallara | | $ | — | | | $ | — | | | $ | — | | | $ | 804,000 | | | $ | 804,000 | | | Mr. Madsen | | $ | — | | | $ | — | | | $ | — | | | $ | 827,000 | | | $ | 827,000 | | | | | | | | | | | | | | | | | | | | | | | | | | | Performance Cash Units | Mr. Adamczyk | | $ | — | | | $ | — | | | $ | — | | | $ | — | | | $ | — | | | Mr. Lewis | | $ | — | | | $ | — | | | $ | — | | | $ | — | | | $ | — | | | Ms. Madden | | $ | — | | | $ | — | | | $ | — | | | $ | — | | | $ | — | | | Ms. Dallara | | $ | — | | | $ | — | | | $ | — | | | $ | — | | | $ | — | | | Mr. Madsen | | $ | — | | | $ | 511,000 | | | $ | 511,000 | | | $ | — | | | $ | 511,000 | | | | | | | | | | | | | | | | | | | | | | | | | | | Benefits and Perquisites | Mr. Adamczyk | | $ | 37,346 | | | $ | — | | | $ | — | | | $ | — | | | $ | 37,346 | | | Mr. Lewis | | $ | 13,017 | | | $ | — | | | $ | — | | | $ | — | | | $ | 17,356 | | | Ms. Madden | | $ | 14,237 | | | $ | — | | | $ | — | | | $ | — | | | $ | 18,996 | | | Ms. Dallara | | $ | 5,198 | | | $ | — | | | $ | — | | | $ | — | | | $ | 6,930 | | | Mr. Madsen | | $ | 8,134 | | | $ | — | | | $ | — | | | $ | — | | | $ | 10,846 | | | | | | | | | | | | | | | | | | | | | | | | | | | All Other-Payments/Benefits | Mr. Adamczyk | | $ | — | | | $ | — | | | $ | — | | | $ | — | | | $ | — | | | Mr. Lewis | | $ | 192,745 | | | $ | — | | | $ | — | | | $ | — | | | $ | 192,745 | | | Ms. Madden | | $ | 258,890 | | | $ | — | | | $ | — | | | $ | — | | | $ | 547,788 | | | Ms. Dallara | | $ | — | | | $ | — | | | $ | — | | | $ | — | | | $ | — | | | Mr. Madsen | | $ | — | | | $ | — | | | $ | — | | | $ | — | | | $ | — | | | | | | | | | | | | | | | Total | Mr. Adamczyk | | $ | 14,062,346 | | | $ | — | | | $ | — | | | $ | 3,910,000 | | | $ | 17,972,346 | | | Mr. Lewis | | $ | 2,755,762 | | | $ | — | | | $ | — | | | $ | 1,107,000 | | | $ | 4,717,101 | | | Ms. Madden | | $ | 2,876,227 | | | $ | — | | | $ | — | | | $ | 1,159,000 | | | $ | 5,196,584 | | | Ms. Dallara | | $ | 2,060,198 | | | $ | — | | | $ | — | | | $ | 804,000 | | | $ | 3,550,930 | | | Mr. Madsen | | $ | 2,255,134 | | | $ | 511,000 | | | $ | 511,000 | | | $ | 827,000 | | | $ | 4,344,846 | |
| | | | | | | | | | | | 81
| |
| | | |Notice and Proxy Statement | 2021 2022
| | | 89 |
EXECUTIVE COMPENSATION TABLES
| | | 07 | | | EXECUTIVE
COMPENSATION TABLES
|
Explanation of Benefits—Termination Events
EXPLANATION OF BENEFITS—TERMINATION EVENTS The following describes the benefits that are quantified in the table above assuming the event occurred on December 31, 2020.2021. In regard to each portion of the benefit, the benefits that are paid in the context of a CIC are, except as noted, the same as the benefits paid other than as a result of a CIC. | | | | | | | | | | Benefit/Event | | | Benefit/Event
| | Amount and Terms of Payments (other than uponOther Than Upon a Change inIn Control) | | Change inIn Control Provisions |
Severance Benefits-Cash Payment
Involuntary termination without cause; CIC termination without cause or by a NEO for good reason. | | •Three years of base salary and bonus for Mr. Adamczyk, and 18 months of base salary and bonus for Messrs. Lewis, Gautam, and Waldron and Ms. Madden.the Other NEOs. •Paid periodically, in cash. •Bonus is equal to target percentage of base salary. •Payment conditioned upon a general release in favor of the Company, non-compete, non-disclosure (indefinite duration), and non-solicitation covenants (two years for customers and two years for employees) and refraining from certain other misconduct. | | •Three years of base salary and bonus for Mr. Adamczyk, and two years of base salary and bonus for Messrs. Lewis, Gautam, and Waldron and Ms. Madden.the Other NEOs. •Amounts are paid in a lump sum within 60 days following the later of the date of termination or the CIC date. | | | | | | Annual Bonus for the Year of Termination-Cash Payment
Annual ICP Plan bonus is payable to NEOs for the year in which a CIC occurs. | | •N/A. | | •Based on achievement of pre-established ICP goals and the MDCC’s assessment of other relevant criteria, for the stub period ending on the CIC (as defined in the ICP Plan) date, prorated through the CIC date. •Paid in cash at the time ICP awards are typically paid to Honeywell executives for the year in which a CIC occurs, but only if the employee is actively employed on the payment date, has been involuntarily terminated other than for cause or has terminated employment for good reason. | | | | | | Performance Cash Units
Performance Cash Unit awards are paid out in the event of death, disability and a qualifying termination of employment upon a CIC. | | •Only Mr. LewisMadsen (for the 2018-20202019-2021 performance cycle) has a Performance Cash Unit (PCU) award issued in 2019 prior to becoming an officer of the Company. PCUs are paid out on a pro rata basis upon death or disability. As the 2018-20202019-2021 PCU performance cycle has already concluded, any payout would be the full amount earned based on actual performance. | | •Upon a CIC, unvested PCUs remain outstanding to the extent assumed by the successor. Following a CIC, unvested PCUs would vest on a pro rata basis in the event of an involuntary termination other than for cause or a voluntary termination for good reason, within 2 years of the CIC event. For a performance cycle that has already concluded, payout would be based on actual performance. For a performance cycle in progress, the prorated payout would be based on target performance. The “Change in Control-Termination of Employment” column includes the full payout for the 2018-20202019-2021 performance cycle for Mr. Lewis.Madsen. |
| | | | | | | | | | 90 | | Notice and Proxy Statement | 2022 |
EXECUTIVE COMPENSATION TABLES | | | | | | | | | Benefit/Event | Amount and Terms of Payments (Other Than Upon a Change In Control) | Change In Control Provisions | Certain Benefits and Perquisites Termination of employment without cause; CIC, voluntary termination of employment for good reason. | | •Basic life insurance coverage is continued at Honeywell’s cost for the severance period. •Medical and dental benefits are continued during the severance period at active employee contribution rates. | | •Basic life insurance coverage is continued at Honeywell’s cost for the severance period. •Medical and dental benefits are continued during the severance period at active employee contribution rates. | | | | | |
| | | | |
| | | Notice and Proxy Statement | 2021
| | 82
|
| | | 07 | | | EXECUTIVE
COMPENSATION TABLES
|
| | | | | | | | Benefit/Event
| | Amount and Terms of Payments
(other than upon a Change in Control)
| | Change in Control Provisions | Other Benefits | | • ServiceIn the case of involuntary termination by the Company without Cause, service credit for pension is provided during the first 12 months of the severance period. | | •If employment terminated upon CIC, service credit for pension purposes during the first 12 months of the severance period. Additional 3 years of age & service credit for pension purposes for Ms. Madden under pre-2007 Corporate CIC Severance Plan provisions. | | | | | |
No Excise Tax Gross-Ups
NO EXCISE TAX GROSS-UPS U.S. tax laws may impose an excise tax on employees who receive benefits in connection with a CIC in certain circumstances and subject to certain conditions. In 2009, the Company amended the Senior Severance Plan to eliminateThe company does not provide for excise tax gross-ups for officers not already eligible for such treatment prior to January 1, 2010. As of December 31, 2020, there were no executive officers remaining with the prior grandfathered treatment. As such, excise tax gross-ups have now been eliminated on a prospective basis.Impact on Equity-Based Awards
gross-ups. IMPACT ON EQUITY-BASED AWARDS This section describes the impact of a termination of employment or a CIC on outstanding stock options, RSUs and Performance Plan Stock Units (PSUs) held by our NEOs. Additional information about these awards is included in the Outstanding Equity Awards Table on pages 73 and 74page 81 of this Proxy Statement. The table below shows the in-the-money value of outstanding unvested stock options, RSUs, PSUs and PSUsPCUs held by our NEOs as of December 31, 2020,2021, based on the closing price of a share of common stock as reported on the New York Stock ExchangeNasdaq on that date ($ 212.70)208.51). These awards are scheduled to vest and to expire on various dates in the future. As described below, the vesting of these awards will be accelerated upon death, disability or a qualifying termination of employment following a CIC. Equity awards issued since April 28, 2014, do not automatically vest upon a CIC to the extent assumed or replaced by the successor in the transaction. In addition, stock options will remain outstanding for different periods depending on the circumstances. The value to a NEO of these provisions depends on the vesting period and remaining terms of the awards. | | | | | | | | | | | | | | | | | | | | | | | | | | | Named Executive Officer | | In-the-Money
Value of Unvested
Stock Options | | | Unvested
RSUs | | | Unvested
PSUs(1) | | | | | | | | | | | | | | | | Darius Adamczyk | | $ | 26,455,707 | | | $ | 10,825,154 | | | $ | 40,075,658 | | Gregory P. Lewis | | $ | 6,163,782 | | | $ | 3,586,760 | | | $ | 4,921,665 | | Anne T. Madden | | $ | 6,399,206 | | | $ | 3,547,411 | | | $ | 8,268,287 | | Rajeev Gautam | | $ | 8,139,095 | | | $ | 2,590,261 | | | $ | 10,621,174 | | John F. Waldron | | $ | 6,385,425 | | | $ | 5,051,200 | | | $ | 8,888,945 | |
| | | | | | | | | | | | | | | | | | | | | | Named Executive Officer | In-the-Money Value of Unvested Stock Options | | Unvested RSUs | | Unvested PSUs(1) | | Mr. Adamczyk | | $ | 13,625,899 | | | $ | 22,020,741 | | | $ | 7,856,935 | | | Mr. Lewis | | $ | 3,680,750 | | | $ | 4,919,168 | | | $ | 2,442,069 | | | Ms. Madden | | $ | 3,768,060 | | | $ | 5,471,094 | | | $ | 2,442,069 | | | Ms. Dallara | | $ | 2,942,265 | | | $ | 4,683,969 | | | $ | 1,990,645 | | | Mr. Madsen | | $ | 2,507,520 | | | $ | 3,799,677 | | | $ | 1,603,998 | |
(1)Includes the portion of unvested PSUs that would vest upon Death, Disability or a qualifying termination upon Change in Control.
(1) | Includes the portion of unvested PSUs that would vest upon Death, Disability or a qualifying termination upon Change in Control.
|
| | | | | | | | | | 83
| |
| | | |Notice and Proxy Statement | 2021 2022
| | | 91 |
EXECUTIVE COMPENSATION TABLES
| | | 07 | | | EXECUTIVE
COMPENSATION TABLES
|
Termination orTERMINATION OR CIC Impact On Outstanding Awards
IMPACT ON OUTSTANDING AWARDS Treatment of outstanding stock plan awards following termination of employment depends on the plan under which the awards were granted, as follows: | | | | | | | | Plan | | Treatment of Stock Options, RSURSUs, PSUs and PSUsPCUs | | | | 2011 Stock Incentive Plan of Honeywell International Inc. and its Affiliates | | •RSUs become vested in full upon death or disability. •Following termination of employment, unless otherwise agreed by the Company pursuant to the terms of the plan, participants (or their beneficiaries) have until the earlier of the original expiration date or the following period in which to exercise vested options:—
–Three (3) years in the event of death, disability or a voluntary or involuntary termination (other than for cause) after qualifying for “early retirement” (age 55 and 10 years of service) or “full retirement” (age 60 and 10 years of service);—
–One (1) year in the case of any other involuntary termination without cause; and—
–Thirty (30) days in the case of a voluntary termination. •These rules are hereinafter referred to as the “2011 Stock Plan Exercise Rules.” •Unvested stock options and RSUs do not automatically vest upon a CIC if rolled over or replaced by the successor. Following a CIC, vesting shall only occur if a participant’s employment is terminated, either by the successor without cause or by the participant for good reason (that is, “double trigger” vesting), within two years following a CIC. These rules are hereinafter referred to as the “Double Trigger CIC Rules”. | | | | 2016 Stock Incentive Plan of Honeywell International Inc. and its Affiliates | | •The Double Trigger CIC Rules apply to unvested stock options and RSUs under this plan. Double trigger vesting also applies to PSUs awarded under this plan where the awards are rolled over or replaced by the successor, with vesting on a pro rata basis at target for incomplete performance periods, and based on the actual earned award for completed performance cycles, and paid within 90 days of a participant’s termination of employment, either by the successor without cause or by the participant for good reason (that is, “double trigger” vesting), within two years following a CIC. RSU and PSU awards that are not rolled over or replaced by the successor vest immediately upon the CIC. •The 2011 Stock Plan Exercise Rules apply to vested stock options under this plan. In the case of Ms. Dallara, the Company agreed that her vested options will expire on the first anniversary of the effective date of her resignation. •There is no acceleration of vesting of awards upon reaching retirement age. Unvested RSUs and a prorated amount of a PSU award are paid upon a termination due to death or disability. Unvested stock options vest upon a termination due to death or disability. |
Defined Terms Used in This Section
| | | | | | | | | | 92 | | Notice and Proxy Statement | 2022 |
EXECUTIVE COMPENSATION TABLES DEFINED TERMS USED IN THIS SECTION As used in the Company’s plans, the following terms are assigned the meanings summarized below. | | | | | | | | Term | | Summary of Definition | | | | Change in Control | | •The acquisition of 30% or more of the Company's common stock; •The purchase of all or part of the common stock pursuant to a tender offer or exchange offer; •A merger where Honeywell does not survive as an independent, publicly-owned corporation; •A sale of substantially all of Honeywell’s assets; or •A substantial change in Honeywell’s Board over a two-year period. •Additionally, under the Senior Severance Plan, any event that the MDCC, in its discretion, determines to be a Change in Control for purposes of that plan; provided that under the 2011 or 2016 Stock Incentive Plan, each of the events described above would only be a Change in Control if it constitutes a “change in control event” within the meaning of United States Department of Treasury Regulation §1.409A-3(i)(5)(i). | | | |
| | | | |
| | | Notice and Proxy Statement | 2021
| | 84
|
| | | 07 | | | EXECUTIVE
COMPENSATION TABLES
|
| | | | | Term
| | Summary of Definition
| | | | Termination for Cause | | •Clear and convincing evidence of a significant violation of the Company’s Code of Business Conduct; •The misappropriation, embezzlement, or willful destruction of Company property of significant value; •The willful failure to perform, gross negligence or intentional misconduct of significant duties that results in material harm to the business of the Company; •The conviction (treating a nolo contendere plea as a conviction) of a felony (whether or not any right to appeal has been or may be exercised); •The failure to cooperate fully in a Company investigation or to be fully truthful when providing evidence or testimony in such investigation; or •Clear and convincing evidence of the willful falsification of any financial records of the Company that are used in compiling the Company’s financial statements or related disclosures, with the intent of violating Generally Accepted Accounting Principles or, if applicable, International Financial Reporting Standards. | | | | Termination for Good Reason | | •A material diminution in the NEO’s authority, duties, or responsibilities; •A material decrease in base compensation; •A material reduction in the aggregate benefits available to the NEO where such reduction does not apply to all similarly-situated employees; •Any geographic relocation of the NEO’s position to a location that is more than 50 miles from his or her previous work location; •Any action that constitutes a constructive discharge; or •The failure of a successor to assume these obligations under the Senior Severance Plan. |
| | | | | | | | | | | | 85
| |
| | | |Notice and Proxy Statement | 2021 2022
| | | 93 |
EXECUTIVE COMPENSATION TABLES
| | | 07 | | | EXECUTIVE
COMPENSATION TABLES
|
CEO PAY RATIO As required by Section 953(b) of the Dodd-Frank Wall Street Reform and Consumer Protection Act, and Item 402(u) of Regulation S-K, we are providing the following information about the relationship of the annual total compensation of the individual identified as our median paid employee and the annual total compensation of Mr. Darius Adamczyk, our Chairman and CEO:As permitted by the SEC rules, the median employee utilized for the 2020 pay ratio disclosure is the same median employee identified and used for the 2018 CEO pay ratio as there were no changes to our employee population or employee compensation arrangements during 2019 and 2020 that would result in a significant change to our pay ratio disclosure. We most recently identified our median employee using our global employee population as of November 1, 2018 (Determination Date). We collected actual base salary, incentive awards paid, and any overtime paid during the 12-month period ending on the Determination Date. As permitted under SEC rules, we annualized the compensation of all newly hired permanent employees during this period.
CEO. To identify the median of the annual total compensation of all our employees, and to determine the annual total compensation of the “median employee”, the methodology and the material assumptions, adjustments and estimates we used were as follows: •For purposes of the 2021 pay ratio disclosure, Honeywell identified a new median employee using our global employee population as of October 31, 2021 (Determination Date). We consideredselected October 31 as the Determination Date, as it was a date within the last three months of 2021, and would allow sufficient time to gather the information to identify the median employee given the global scope of our operations. •Before applying the “De Minimis Exemption” adjustment permitted under SEC rules (described below), our global population asconsisted of November 1, 2018.approximately 120,063 individuals • | | Before applying the “De Minimis Exemption” adjustment permitted under SEC rules (described below), our global population consisted of approximately 123,408 individuals
|
| | | | | | | | | Total U.S. Employees (1) | | | 53,815
| | | | | 54,192 | Total non-U.S. Employees | | | 69,593
| | | | (no65,871 (no exclusions)
| | Total Global Workforce | | | 123,408
| | | | | 120,063 |
(1)Total U.S. Employees includes Sandia National Laboratories and Kansas City National Security Campus workforces, which are U.S. Department of Energy facilities managed by Honeywell as a contract operator. We applied the De Minimis Exemption adjustment to exclude a total of 6,0985,212 employees located in jurisdictions outside the U.S. Such employees represent less than five percent of our Total Global Workforce. The countries and approximate number of Honeywell employees excluded were: Algeria (54), Angola (6), Argentina (267)(225), Azerbaijan (3), Bangladesh (2), Belarus (1), Brazil (768), Bulgaria (229), Colombia (124), Croatia (8), Ecuador (1)(2), Egypt (31), Greece (4)(93), Hungary (214)(300), Indonesia (524), Iraq (10), Israel (30)(134), Jordan (17), Kazakhstan (72), Kenya (13), Kuwait (188)(14), Morocco (131)(119), Pakistan (7)(4), Peru (39), Philippines (135)(165), Portugal (45)Poland (735), Russian Federation (866)(767), Slovakia (1,310)(859), Thailand (561)(552), Tunisia (136)(951), Turkey (242)(211), Ukraine (34), Uzbekistan (4), Venezuela (20)(35), and Vietnam (4)Uzbekistan (2). Total Workforce for Determination of Median Employee: | | | | | | | | | Total U.S. Employees | | | 53,815
| | | | | 54,192 | Total non-U.S. Employees | | | 63,495
| | | | (excluding 6,098 60,659 (excluding 5,212
employees)
| | Total Global Workforce | | | 117,310
| | | | | 114,851 |
For
To identify the median employee from our employee population, we collected actual base salary and incentive awards paid during the 12-month period ending on the Determination Date. As permitted under SEC rules, we annualized the compensation of all newly hired permanent employees during this period. Using this methodology, our median employee was determined to be a full-time employee based in the United States. The annual total compensation for our median employee in calendar 2020,2021, our last completed fiscal year:year, was $75,529, calculated in accordance with the rules applicable to the Summary Compensation Table (SCT) of this proxy statement. The annual total compensation of thefor our median employee of our Company (other than our CEO) was $64,438; and includes $9,474 in Company-paid healthcare benefits.TheFor 2021, the annual total compensation of the CEO for purposes of determining the CEO Pay Ratio was $19,075,281.
$26,106,477, which is $6,357 higher than the amount shown in the SCT because of the inclusion of Company-paid healthcare benefits, which are not reflected on the SCT in accordance with SEC rules.Based on this information, for 2020,2021, the ratio of the annual total compensation of Mr. Adamczyk, our CEO, to the median of the annual total compensation of all employees was estimated to be 296346 to 1. The pay ratio is a reasonable estimate calculated in a manner consistent with SEC rules based on our payroll and employment records and the methodology described above. The SEC rules for identifying the median compensated employee and calculating the pay ratio based on that employee’s annual total compensation allow companies to adopt a variety of methodologies, to apply certain exclusions, and to make reasonable estimates and assumptions that reflect their compensation practices. As such, the pay ratio reported by other companies may not be comparable to the pay ratio reported here, as other companies may have different employment and compensation practices and may utilize different methodologies, exclusions, estimates and assumptions in calculating their own pay ratios. | | | | | | | | |
94 | | |Notice and Proxy Statement | 2021
| | 86
2022 |
| | | 08 | | | PROPOSAL 3:
APPROVAL OF INDEPENDENT ACCOUNTANTS
|
PROPOSAL 3: APPROVAL OF INDEPENDENT ACCOUNTANTS The Audit Committee, which consists entirely of independent directors, is directly responsible for the appointment, compensation, retention, and oversight of the Company’s independent registered public accounting firm. The Audit Committee is recommending approval of its appointment of Deloitte & Touche LLP (Deloitte) as independent accountants for Honeywell to audit its consolidated financial statements for 20212022 and to perform audit-related services. These services include reviewing our quarterly interim financial information and periodic reports and registration statements filed with the SEC and consultation in connection with various accounting and financial reporting matters. If shareowners do not approve, the Audit Committee will reconsider the appointment. The Audit Committee, and Honeywell’s Board of Directors, believe that the continued retention of Deloitte as the Company’s independent registered public accounting firm is in the best interests of the Company and its shareowners. Honeywell has been advised by Deloitte that it will have a representative present virtually at the Annual Meeting who will be available to respond to appropriate questions. The representative will also have the opportunity to make a statement if he or she desires to do so.
INDEPENDENT ACCOUNTING FIRM FEES Deloitte provided the following audit and other services during 20202021 and 2019: | | | | | | | | | | | | | | | | | | | | | | | (in millions of $) | | 2020 | | | 2019 | | | | | | | | | | | | | | | | Audit Fees | | $ | 16.93 | | | $ | 17.88 | | | • Annual integrated audit of the Company’s consolidated financial statements, and internal control over financial reporting, statutory audits of foreign subsidiaries, attest services, consents, issuance of comfort letters, and review of documents filed with the SEC. | Audit-Related Fees | | $ | 1.76 | | | $ | 5.64 | | | • Audit-related services in both 2020 and 2019 related primarily to carve out audits and agreed upon procedures. | Tax Fees | | | — | | | | — | | | • No tax services in 2020 or 2019. | All Other Fees | | | — | | | | — | | | | Total Fees | | $ | 18.69 | | | $ | 23.52 | | | |
2020: | | | | | | | | | | | | | | | | | | | | | | | | | (In Millions of $) | 2021 | | 2020 | | | | Audit Fees | $16.94 | | $ | 16.93 | | | •Annual integrated audit of the Company’s consolidated financial statements, and internal control over financial reporting, statutory audits of foreign subsidiaries, attest services, and review of documents filed with the SEC. | | Audit-Related Fees | $ | 4.71 | | | $ | 1.76 | | | •Audit-related services in both 2021 and 2020 related primarily to carve out audits, consents, issuance of comfort letters, and agreed upon procedures. The year-over-year fee increase was primarily attributable to higher costs for carve-out audits in 2021, including the Quantinuum business. | | Tax Fees | $ | 0.03 | | | | — | | •Fees related to tax compliance in 2021. No tax services in 2020. | | All Other Fees | $ | 0.31 | | | | — | | •Fees related to advisory and consulting services. No services in 2020. | | Total Fees | $ | 21.99 | | | $ | 18.69 | | | |
The Audit Committee reviews non-audit services proposed to be provided by Deloitte to determine whether they would be compatible with maintaining Deloitte’s independence. The Audit Committee has established policies and procedures for the engagement of Deloitte to provide non-audit services. Specifically: •The Audit Committee reviews and pre-approves an annual budget for specific categories of non-audit services (that are detailed as to the particular services) which Deloitte is to be permitted to provide (those categories do not include any of the prohibited services in the auditor independence provisions of the Sarbanes-Oxley Act of 2002). This review includes an evaluation of the possible impact of the provision of such services by Deloitte on the firm’s independence in performing its audit and audit-related services. •The Audit Committee reviews the non-audit services performed by, and amount of fees paid to, Deloitte, by category in comparison to the pre-approved budget. •The engagement of Deloitte to provide non-audit services that do not fall within a specific category of pre-approved services, or that would result in the total fees payable to Deloitte in any category to exceed the pre-approved amount, requires the prior approval of the Audit Committee. Between regularly scheduled meetings of the Audit Committee, the Audit Committee Chair may represent the entire committee for purposes of review and approval of any such engagement, and the Chair is required to report on all such interim reviews at the committee’s next regularly scheduled meeting. | | | | | | | | | | | | 87
| |
| | | |Notice and Proxy Statement | 2021 2022
| | | 95 |
PROPOSAL 3: APPROVAL OF INDEPENDENT ACCOUNTANTS
| | | 08 | | | PROPOSAL 3:
APPROVAL OF INDEPENDENT ACCOUNTANTS
|
AUDIT COMMITTEE REPORT The Audit Committee consists of the sixfive directors named below. Each member of the Audit Committee is an independent director as defined by applicable SEC rules and stock exchange listing standards. Management is responsible for Honeywell’s internal controls and preparing the Company’s consolidated financial statements. The Company’s independent accountants are responsible for performing an independent audit of the consolidated financial statements in accordance with the standards of the Public Company Accounting Oversight Board (United States) and issuing a report thereon. The Committee is responsible for overseeing the conduct of these activities and subject to shareowner ratification, appointing the Company’s independent accountants. As stated above and in the Committee’s charter, the Committee’s responsibility is one of oversight. The Committee does not provide any expert or special assurance as to Honeywell’s financial statements concerning compliance with laws, regulations, or generally accepted accounting principles. In performing its oversight function, the Committee relies, without independent verification, on the information provided to it and on representations made by management and the independent accountants. The Audit Committee reviewed and discussed Honeywell’s consolidated financial statements for the year ended December 31, 20202021 with management and the independent accountants for 2020,2021, Deloitte & Touche LLP (Deloitte). Management represented to the Audit Committee that the Company’s consolidated financial statements were prepared in accordance with generally accepted accounting principles. The Audit Committee discussed with Deloitte matters required to be discussed by the applicable requirements of the Public Company Accounting Oversight Board and the SEC. The Committee also reviewed, and discussed with management and Deloitte, management’s report and Deloitte’s report on internal control over financial reporting in accordance with Section 404 of the Sarbanes-Oxley Act. Honeywell’s independent accountants provided to the Audit Committee the written disclosures required by the applicable requirements of the Public Company Accounting Oversight Board regarding the independent accountant’s communications with the Audit Committee concerning independence, and the Committee discussed with the independent accountants their independence. The Audit Committee concluded that Deloitte’s provision of non-audit services, as detailed in the table on page 87,95, to the Company and its affiliates is compatible with Deloitte’s independence. Based on the Audit Committee’s discussion with management and the independent accountants and the Audit Committee’s review of the representations of management and the report of the independent accountants, the Committee recommended thatto the Board of Directors includethat the audited consolidated financial statements in the Form 10-K for the year ended December 31, 2020,2021, be filed with the SEC. George Paz (Chair)
Kevin Burke
D. Scott Davis
Linnet F. Deily
Judd Gregg
Robin L. Washington
 |
| | | | | | | | THE BOARD OF DIRECTORS UNANIMOUSLY RECOMMENDS A VOTE FOR THE APPROVAL OF THE APPOINTMENT OF DELOITTE AND TOUCHE LLP AS INDEPENDENT ACCOUNTANTS. |
| | | | |
| | | Notice and Proxy Statement | 2021
| | 88
|
| | | 09 | | | PROPOSAL 4:
SHAREOWNER PROPOSAL—SHAREHOLDER RIGHT TO ACT BY WRITTEN CONSENT
|
PROPOSAL 4: SHAREOWNER PROPOSAL—
SHAREHOLDER RIGHT TO ACT BY WRITTEN CONSENT
This proposal has been submitted by John Chevedden, 2215 Nelson Ave., No. 205 Redondo Beach, CA 90278 (the beneficial owner of 100 shares of common stock):
Shareholders request that our board of directors undertake such steps as may be necessary to permit written consent by shareholders entitled to cast the minimum number of votes that would be necessary to authorize the action at a meeting at which all shareholders entitled to vote thereon were present and voting. This includes shareholder ability to initiate any appropriate topic for written consent.
Taking action by written consent in place of a meeting is a means shareholders can use to raise important matters outside the normal annual meeting cycle like the election of a new director.
This proposal topic won 40% support at a previous Honeywell annual meeting. And this was before the shareholder right to call a special in-person shareholder meeting was eliminated by the 2020 pandemic.
Ms. Linnet Deily, the Chair of the Honeywell Governance Committee, seems to have completely overlooked the safeguards that can be built into granting shareholders a right to act by written consent.
The Bank of New York Mellon Corporation (BK) said it adopted written consent in 2019 after 45%-support (clearly less than a majority vote) for a written consent shareholder proposal. And this was a year before the pandemic put an end to in-person shareholder meetings – perhaps forever. It is so much easier for management to conduct an online shareholder meeting that management is now spoiled and will never want to return to an in-person shareholder meeting.
Shareholders need to be able to accomplish more outside of a shareholder meeting due to the onslaught of online shareholder meetings replacing in-person shareholder meetings.
With the near universal use of online annual shareholder meetings starting in 2020 shareholders no longer have the right to discuss concerns with other shareholders and with their directors at a shareholder meeting. Shareholder meetings can now be online meetings which has an inferior format to a Zoom meeting.
Shareholders are also severely restricted in making their views known at online shareholder meetings because all challenging questions and comments can be screened out at an online meeting.
For instance Goodyear management became an example of turning an online shareholder meeting into a mute button meeting. Goodyear management hit the mute button right in the middle of a formal shareholder proposal presentation at its 2020 shareholder meeting. With a deep slumping stock price Goodyear management simply did not want shareholders to hear constructive shareholder criticism.
Shareholders now need to have the option more than ever to take action outside of a shareholder meeting since online shareholder meetings are devoid of significance.
Please vote yes: Shareholder Right to Act by Written Consent–Proposal 4
BOARD RECOMMENDATION
The Honeywell Board recommends that shareowners vote AGAINST this proposal for the following reasons:
 | Shareowners holding 15% of our outstanding shares already have the right to call a special (either in-person or in a virtual format) at any time.
|
| The Board believes that shareowner action by written consent is unnecessary in light of our shareowners’ right to call special meetings, which can be in-person or virtual, based on the written request of 15% of outstanding shares. Allowing any shareowner, regardless of ownership interest, to initiate a potentially unlimited number of written consent solicitations on any topic at any time could enable a single shareowner to advance its own narrow, parochial interests to the detriment of the majority of shareowners. The 15% threshold required to call a special meeting of shareowners guards against the exertion of undue influence by individual shareowners in pursuit of special interests that may be inconsistent with our shareowners’ long-term best interests. The Board believes the Company’s current governance practices strike the right balance between the rights of shareowners to have a voice in how Honeywell is governed, on the one hand, and protecting against abusive actions that may disrupt the effective management of our Company and be detrimental to shareowner interests, on the other.
|
| | | | | | | | | 89
96 | |
| | | |Notice and Proxy Statement | 2021
| | | 2022 |
PROPOSAL 4: SHAREOWNER PROPOSAL—SPECIAL SHAREHOLDER MEETING IMPROVEMENT The following proposal was submitted for inclusion in this Proxy Statement by John Chevedden (the beneficial owner of 100 shares of common stock). We will provide the proponent’s address promptly upon a shareowner’s oral or written request. If Mr. Chevedden, or a representative who is qualified under state law, properly presents such proposal for a vote, then the proposal will be voted on at the Annual Meeting. In accordance with rules of the SEC, other than minor formatting changes, we are reprinting Mr. Chevedden’s proposal and supporting statement as it was submitted to us and we take no responsibility for its content: Proposal 4 – Special Shareholder Meeting Improvement Shareholders ask our board to take the steps necessary to amend the appropriate company governing documents to give the owners of a combined 10% of our outstanding common stock the power to call a special shareholder meeting. Although now it theoretically takes 15% of all shares to call for a special shareholder meeting, this translates into 20% of the Honeywell shares that typically vote at the annual meeting. It would be hopeless to think that the shares that do not have time to vote at the annual meeting would have time to take the special procedural steps to call for a special shareholder meeting. It is important to vote for this Special Shareholder Meeting Improvement proposal because we have no right to act by written consent. Many companies provide for both a shareholder right to call a special shareholder meeting and a shareholder right to act by written consent. Southwest Airlines and Target are companies that do not provide for shareholder written consent and yet provide for 10% of shares to call for a special shareholder meeting. Plus Honeywell shareholders gave 42% support to the 2021 shareholder proposal calling for a shareholder right to act by written consent. This 42% support may have represented 51% support from the shares that have access to independent proxy voting advice and are not forced to rely on management scare tactics. Management failed to recognize the elementary fact that written consent protects shareholder rights because written consent can be structured so that all shareholders receive ample notice. Plus in order to reduce shareholder support for written consent to 42% Honeywell management reached into the corporate war chest and sent out a voters guide for dummies, who want to vote in lockstep with management, shortly before the annual meeting. When reading the management statement next to this 2022 proposal or the 2021 proposal please remember that there is a formal process to root out any misleading shareholder text in a shareholder proposal but there is no formal process to root out misleading management text next to a shareholder proposal. To help make up for our lack of a right to act by written consent we need the right of 10% of shares to call for a special shareholder meeting. Please vote yes: Shareholder Meeting Improvement–Proposal 4
| | | | | | | | | | | | | 09 Notice and Proxy Statement | 2022
| | PROPOSAL 4:
SHAREOWNER PROPOSAL—SHAREHOLDER RIGHT TO ACT BY WRITTEN CONSENT
97 |
| Majority of shareowners with whom we spoke believe that the right to act by written consent is not warranted where shareowners already have the right to call a special meeting.
|
| We have discussed written consent proposals with our largest shareowners as part of our shareowner outreach program in the years when this proposal was raised. The overwhelming majority of those shareowners shared their belief that the right to act by written consent is not warranted where shareowners already have the right to call a special meeting. Since we lowered the threshold for calling a special meeting in 2018 (from 20% to 15%), support for our position has only increased, both in conversations with our largest shareowners and in our annual meeting voting results.
|
| Action by written consent is a less democratic means for shareowners to express their views.
|
| Shareowner meetings are a more democratic way for shareowners to express their views on important financial, governance, or strategic questions related to Honeywell. In a shareowner meeting—whether a regular, annual meeting, or a special meeting called by shareowners holding 15% or more of our shares—voting occurs on a specified date that is publicly announced well in advance of the meeting. All interested parties have an opportunity to express their views and solicit proxies from shareowners. By contrast, action by written consent does not require notice to all shareowners about a proposed action nor does it permit differing views on a particular action or issue to be fully aired and debated. The Board does not believe that it is appropriate for some shareowners to take action affecting all shareowners without first informing all shareowners of the proposed action and allowing all shareowners to voice their views and vote on the proposed action.
|
| In an unsolicited change in control scenario, action by written consent can undermine the Board’s ability to obtain the highest value for existing shareowners.
|
| The prohibition against shareowner action by written consent also encourages a party making an unsolicited takeover bid to negotiate with the Board to reach terms that are fair and in the best interests of all shareowners. The Board is best-positioned to weigh the merits of takeover offers, negotiate on behalf of all shareowners, and protect shareowners from abusive takeover tactics. The ability of shareowners to approve the sale of the company via written consent could result in shareowners receiving less value than they might otherwise receive as the Board may not have an opportunity to assess proposed actions or seek higher-value alternatives. Activist shareowners could also use a written consent solicitation to remove and replace directors and effectively assume control without having to pay a control premium to shareowners.
|
| The right to act by written consent is unnecessary given related Honeywell corporate governance best practices that are already in place.
|
| The shareowner’s proposal should be evaluated in the context of our world-class governance practices that empower and protect the interests of our shareowners, such as:
|
PROPOSAL 4: SHAREOWNER PROPOSAL— SPECIAL SHAREHOLDER MEETING IMPROVEMENT BOARD RECOMMENDATION The Honeywell Board recommends that shareowners vote AGAINSTthis proposal for the following reasons:  Shareowners holding 15% of our outstanding shares already have the right to call a special meeting (either in-person or in a virtual format) at any time. Shareowners holding 15% of our outstanding shares already have the right to call a special meeting (either in-person or in a virtual format) at any time.The Board believes that the current 15% threshold strikes an appropriate balance between enhancing shareowner rights while not providing a mechanism for individual shareowners to pursue special interests that are not in the best interests of the Company and its shareowners in general. The proposed threshold is also consistent with the proposition that special meetings should be limited to extraordinary matters and/or significant strategic concerns that require attention prior to the next annual meeting. Our robust shareowner outreach and engagement program provides shareowners with numerous avenues to voice their opinions and encourage Board accountability and responsiveness to shareowner feedback. The Company’s strong corporate governance practices include a robust shareowner engagement program. Company leaders meet regularly with shareowners to discuss matters of importance to each shareowner, including strategy, operational performance, environmental, social, and governance matters, particularly diversity, equity and inclusion and human capital matters, and business practices. The Company also meets with shareowners throughout the year to share perspectives on corporate governance, executive compensation, and related matters. For additional information about the Company’s shareowner engagement program and actions it has taken in response to these discussions, please see “Corporate Governance--Shareowner Outreach and Engagement” above. In an unsolicited change in control scenario, the ability for a small minority of shareowners to call a special meeting can undermine the Board’s ability to obtain the highest value for existing shareowners. The power to call a special meeting has historically been a tool for acquirors in the hostile merger and acquisition context. By maintaining our current ownership threshold for calling a special meeting at 15%, we are better able to ensure that a special meeting is called only when supported by a significant number of our shareowners. The 15% threshold also encourages a party making an unsolicited takeover bid to negotiate with the Board to reach terms that are fair and in the best interests of all shareowners. The Board is best-positioned to weigh the merits of takeover offers, negotiate on behalf of all shareowners, and protect shareowners from abusive takeover tactics. A reduction in shareowner ownership threshold to call a special meeting is unnecessary given related Honeywell corporate governance best practices that are already in place. The shareowner’s proposal should be evaluated in the context of our world-class governance practices that empower and protect the interests of our shareowners, such as: •15% threshold for shareowners’ right to call a special meeting of shareowners (reduced from 20% in 2018 in response to shareowner sentiment). •The adoption of a proxy access By-laws amendment (instituted in 2015 in response to shareowner sentiment). The ability of shareowners to submit live proposals for presentation at an annual meeting.
•The establishment of an independent Lead Director role and designation of the Lead Director as a point of contact for shareowner communications (instituted in 2014 in response to shareowner feedback). See “Communicating With the Board” on page 96. 111.The annual•Annual election of directors and majority voting in uncontested director elections.
•The authority of the Lead Director and the Chair of the Corporate Governance and Responsibility Committee to call special meetings of the Board at any time for any reason. •The elimination of supermajority voting provisions in our charter documents. •Shareowner approval of poison pills. Robust shareowner outreach and engagement practices. See “Shareowner Outreach and Engagement” beginning on page 19 for a description of our shareowner engagement activities.
•Virtual annual meeting format that allows shareowner proponents the opportunity to present their proposal live via audio during the meeting and for shareowners to submit questions before and during the meeting. Given the actions that Honeywell has taken to protect shareowner value, increase shareowner rights, and ensure director accountability, the Board believes that adoption of the above proposal would not add significant value to the Company’s performance or to shareowners’ interests. It would, instead, have a detrimental effect by providing the means for short-term or individual shareowners to act in their own self-interest by advocating proposals that neither enhance shareowner value nor advance the interests of shareowners as a whole.  |
| | | | | | | | THE BOARD OF DIRECTORS UNANIMOUSLY RECOMMENDS A VOTE AGAINST THIS PROPOSAL. |
| | | | | | | | |
98 | | |Notice and Proxy Statement | 2021
| | 90
2022 |
PROPOSAL 5: SHAREOWNER PROPOSAL—CLIMATE LOBBYING REPORT The following proposal was submitted for inclusion in this Proxy Statement by Proxy Impact on behalf of the Lisette Cooper 2015 Trust (the beneficial owner of 26 shares of common stock). We will provide the proponent’s address promptly upon a shareowner’s oral or written request. If Proxy Impact, or a representative who is qualified under state law, properly presents such proposal for a vote, then the proposal will be voted on at the Annual Meeting. In accordance with rules of the SEC, other than minor formatting changes, we are reprinting Proxy Impact’s proposal and supporting statement as it was submitted to us and we take no responsibility for its content: Honeywell International Inc. - 2022 Climate Lobbying Report RESOLVED: Shareholders request that the Board of Directors conduct an evaluation and issue a report (at reasonable cost, omitting proprietary information) describing if, and how, Honeywell’s lobbying activities (direct and through trade associations and other organizations) align with the goal of the Paris Agreement to limit average global warming to well below 2 degrees Celsius (ideally 1.5 degrees Celsius) and how Honeywell plans to mitigate risks presented by any misalignment. SUPPORTING STATEMENT Scientists assert that greenhouse gas emissions must decline by 45 percent from 2010 levels by 2030 to limit global warming to 1.5 degrees Celsius. If that goal isn’t met, emissions will need substantial reductions thereafter, at a higher financial cost, to compensate for the slow start on the path to global net zero emissions.i The United Nations Environment Programme reports that critical gaps remain between government commitments and the actions required to prevent the worst effects of climate change.ii Companies have an important and constructive role to play in enabling policymakers to close these gaps. Corporate lobbying that is inconsistent with the Paris Agreement presents increasingly material risks to investors, including systemic risks to our financial systems, as delays in emissions reductions increase the compounding physical risks of climate change, threaten economic stability, and heighten uncertainty and volatility in investment portfolios.iii Of particular concern are trade associations and other politically active organizations that speak for business but too often present forceful obstacles to progress in addressing the climate crisis. Some companies use such organizations to launch public relations campaigns to hamper emissions reduction progress. As investors, we view fulfillment of the Paris Agreement’s goal as an imperative to discharging our fiduciary duties; we are convinced that unabated climate change will have a devastating impact on political stability and infrastructure, impair access to finance and insurance, exacerbate health risks and costs, and therefore significantly impact the value of our investments. Honeywell’s 10K recognizes the physical and transition risks associated with climate change as a material risk. The company has publicly affirmed the science of climate change and has made statements supporting the need for ambitious climate policies, and claims a commitment to being carbon neutral by 2035. Yet Honeywell has not disclosed its support for the Paris Climate Agreement and it belongs to several organizations that have lobbied against Paris-aligned climate policy. The company is a member of major trade associations with track records of opposing science-based climate policies. Honeywell is a member of, and its executives sit on the boards of the U.S. Chamber of Commerce, American Fuel and Petrochemical Manufactures and the National Association of Manufacturers. It is also a member of the Business Roundtable. Honeywell has not disclosed any efforts to assess these associations against science-based policy principles or to engage these associations to evolve their positions to align with climate science. Thus, we urge the Board and management to assess Honeywell's climate related lobbying and report to shareholders. i https://unfccc.int/news/updated-ndc-synthesis-report-worrying-trends-confirmed ii https://www.unep.org/resources/emissions-gap-report-2021 iii https://www.occ.gov/news-issuances/speeches/2021/pub-speech-2021-116.pdf?source=email | | | | | | | | | | | | | 10 Notice and Proxy Statement | 2022
| | ADDITIONAL
INFORMATION
99 |
PROPOSAL 5: SHAREOWNER PROPOSAL—CLIMATE LOBBYING REPORT BOARD RECOMMENDATION The Honeywell Board recommends that shareowners vote AGAINSTthis proposal for the following reasons: Honeywell has conducted an evaluation of its lobbying activities for alignment with the goals of the Paris Agreement, and has published a report that addresses the topics requested in the proposed resolution. Following receipt of the shareowner proposal and subsequent meetings with the proponent, Honeywell conducted an evaluation of our lobbying activities and the public statements of trade associations that receive membership dues of $50,000 or more from Honeywell (“Honeywell Trade Associations”) to assess alignment with the goals of the Paris Agreement. Having completed the evaluation, the Company is pleased to respond that we have already issued a report that describes Honeywell’s climate-related lobbying activities and assesses alignment of the Honeywell Trade Associations’ climate-related public statements with Paris Agreement goals. The report, titled “Climate-Related Lobbying Report,” is available at investor.honeywell.com (see “ESG/ESG Information”). As discussed in the Climate-Related Lobbying Report, we worked with an outside firm to evaluate the climate-related public statements made by Honeywell Trade Associations that hold an active position on climate change, and we did not identify any material misalignment with Honeywell’s climate-related objectives or the goals of the Paris Agreement. Honeywell further enhanced our political disbursements governance framework to enable go-forward monitoring of how political spending aligns with Honeywell’s sustainability objectives. To ensure that we continue to monitor alignment of political spending with our sustainability objectives, Honeywell adopted additional enhancements to our governance processes by expanding the mandate of the bipartisan Political Contributions Advisory Board (the “Advisory Board”). Comprised of leaders representing a cross-section of businesses, functions, and political views, the Advisory Board was established in 2020 to ensure alignment of HIPAC campaign finance disbursements with Honeywell’s Foundational Principles – Integrity and Ethics, Inclusion and Diversity, and Workplace Respect. Advisory Board decisions are informed by third-party due diligence reports identifying statements or activities that present potential misalignment, and notable Advisory Board decisions are reported to the Company’s Corporate Governance and Responsibility Committee. This year, Honeywell expanded the Advisory Board’s mandate to include review of (i) use of corporate funds for political contributions (in addition to HIPAC disbursements), (ii) memberships in third party organizations, like trade associations, and (iii) alignment of proposed disbursements with Honeywell’s sustainability goals. Honeywell is considered a “trendsetter” in providing transparency into our political contributions and lobbying activities, and we have continued to enhance the breadth and depth of our disclosures to be responsive to our stakeholders. The Center for Political Accountability (CPA) identifies Honeywell as a “Trendsetter” in its CPA-Zicklin Index of Corporate Political Disclosure and Accountability. The CPA is a non-profit, non-partisan organization that measures and rates the transparency, policies, and practices of the S&P 500 with regard to political disclosure and accountability. Our score in 2021 puts us in the top 5% of the S&P 500 companies assessed by CPA in its report. This recognition is consistent with Honeywell’s track record of enhancing our disclosures to be responsive to our shareowners’ need for sufficient information to assess whether Honeywell’s participation in the political process poses investment risk. Our disclosure, including our recently published Climate-Related Lobbying Report, is available on our website at investor.honeywell.com (see “ESG/ESG Information”). | | | | | | | | | THE BOARD OF DIRECTORS UNANIMOUSLY RECOMMENDS A VOTE AGAINST THIS PROPOSAL. | | |
| | | | | | | | | | 100 | | Notice and Proxy Statement | 2022 |
PROPOSAL 6: SHAREOWNER PROPOSAL—ENVIRONMENTAL AND SOCIAL DUE DILIGENCE The following proposal was submitted for inclusion in this Proxy Statement by the Franciscan Sisters of Allegany (the beneficial owner of 20 shares of common stock). We will provide the proponent’s address promptly upon a shareowner’s oral or written request. If the Franciscan Sisters of Allegany, or a representative who is qualified under state law, properly presents such proposal for a vote, then the proposal will be voted on at the Annual Meeting. In accordance with rules of the SEC, other than minor formatting changes, we are reprinting the Franciscan Sisters of Allegany’s proposal and supporting statement as it was submitted to us and we take no responsibility for its content: Environmental and Social Due Diligence Resolved: Shareholders request the Board of Directors report on the company’s due diligence process to identify and address environmental and social risks related to emissions, spills, or discharges from Honeywell’s operations and value chain. The report should: •Explain the types and extent of stakeholder consultation; and •Address Honeywell’s plans to track effectiveness of measures to assess, prevent, mitigate, and remedy adverse impacts on the environment and human health Whereas: Honeywell’s operations are linked to significant pollution incidents, including PCB contamination, violation of air quality standards, and liability for numerous EPA Superfund Sites.1 Failure to adequately assess and mitigate environmental and social impacts from company operations often results in litigation, project delays, and significant fines. For instance, Honeywell has reportedly incurred over $261 million in fines since 2000, over half of which are related to environmental penalties.2 The company is also ranked in the top 10 companies responsible for water pollution globally, according to a 2020 report.3 Honeywell lists material environmental liabilities as an operational risk and anticipates future environmental lawsuits, claims, and costs.4 This “cost of doing business” for the company has disparate and significant costs for community members, public health, and the environment.5 In 2020, New Jersey filed a lawsuit against Honeywell for allegedly knowingly polluting water and soil with cancer-causing PCBs.6 In 2019, Honeywell reached settlements to pay up to $16.2 million in South Carolina and $4 million in Georgia for PCB contamination as well.7 In June 2021, Honeywell and two other companies agreed to pay over $65 million for allegedly contaminating drinking water in New York with PFAS, a long lasting chemical associated with developmental and reproductive issues, cancer, and immunological effects.8 The company is also facing lawsuits over endangering residents with hazardous waste contamination from its Illinois uranium facility and for soil and groundwater contamination at the Gary/Chicago International Airport.9 Fenceline communities have criticized Honeywell for lack of effective community consultation surrounding pollution incidents, and for insufficient cleanup.10 A legacy Honeywell pollution coke smoke stack in Tonawanda, NY is linked to decades of health impacts, including elevated cancer risks, cardiopulmonary disease, and birth defects.11 Community members allege they have not been adequately consulted in cleanup efforts, and Honeywell is lobbying to reclassify the site, which may result in less comprehensive remediations.12 Failure to adequately address environmental and social risks poses material legal and regulatory risks to the company and its shareholders. Honeywell reserved $660 million for environmental liabilities in 2020 but is unable to reasonably estimate future potential costs for environmental liabilities.13 Honeywell does not disclose any detailed information on its processes for community consultation beyond philanthropy initiatives. Investors lack sufficient disclosure on how Honeywell’s Environmental and Social initiatives and other due diligence processes identify and address environmental and social risks associated with its pollution. 1 https://www.nj.com/news/2020/11/nj-sues-over-decades-of-pollution-along-hudson-river.html ; https://www.epa.gov/enforcement/case-summary-29-million-settlement-clean-saltwater-marsh-lcp-chemicals-superfund- site ; https://grconnect.com/tox100/ry2018/index.php?search=yes&company2=3247 2 https://violationtracker.goodjobsfirst.org/parent/honeywell-international 3 https://peri.umass.edu/toxic-100-water-polluters-index-current 4 https://s27.q4cdn.com/359586471/files/doc_downloads/proxy_materials/2021/HON-2020-Annual-Report.pdf 5 https://www.justice.gov/opa/pr/honeywell-and-others-fund-restoration-natural-resources-and-conserve-natural-habitat- along 6 https://www.northjersey.com/story/news/environment/2020/11/10/honeywell-superfund-lawsuit-nj-over-edgewater-nj- and-hudson-river-contamination/6224306002/ 7 https://www.wsoctv.com/news/local/honeywell-international-paper-commit-to-162m-cleanup-of-contaminated-site-in- nc/942112586/ ; https://thebrunswicknews.com/news/local_news/dnr-settles-with-honeywell-on-lcp- cleanup/article_33e82090-8bb7-5cdc-8f2c-019034491318.html 8 https://topclassactions.com/lawsuit-settlements/medical-problems/cancer-medical-problems/residents-reach-65m-with- saint-gobain-3m-honeywell-over-tainted-water-supply/ 9 https://www.law.com/2021/07/27/honeywell-hit-with-environmental-lawsuit-over-uranium- storage/?slreturn=20210629100730 ; https://casetext.com/case/garychi-intl-airport-auth-v-honeywell-intl-inc-1 10 https://indiancountrytoday.com/archive/onondaga-seek-voice-in-lake-cleanup-nation-wants-principled-negotiations 11 https://www.justice.gov/sites/default/files/usao-wdny/legacy/2013/09/25/Coke_49.pdf 12 https://www.cacwny.org/2019/07/honeywell-responsible-for-tonawanda-coke-site-remediation/ 13 https://s27.q4cdn.com/359586471/files/doc_downloads/proxy_materials/2021/HON-2020-Annual-Report.pdf | | | | | | | | | | | | | Notice and Proxy Statement | 2022 | | 101 |
PROPOSAL 6: SHAREOWNER PROPOSAL—ENVIRONMENTAL AND SOCIAL DUE DILIGENCE BOARD RECOMMENDATION The Honeywell Board recommends that shareowners vote AGAINSTthis proposal for the following reasons: Honeywell has published a report that addresses the topics requested in the proposed resolution. Honeywell is pleased to respond that we have augmented our public disclosures to provide additional detail regarding long-standing processes for identifying and addressing environmental and social risks related to our operations and our legacy responsibilities. This report, titled “Processes to Identify and Address Environmental and Social Risk,” is available at investor.honeywell.com (see “ESG/ESG Information”) (the “Report”) and supplements the information already available on our website, including our Sustainable Opportunity Policy, our Health, Safety, Environmental, Product Stewardship, and Sustainability Management Systems Manual, our Corporate Citizenship Report, and our Brownfields Report. We believe that responsible citizenship requires robust processes to identify and mitigate the potential environmental and social impacts of our current operations. It also requires proactive processes for identifying and addressing legacy contamination at our former sites with a view toward ensuring that any potential environmental issues are addressed and creating new assets aligned with community priorities. Our well-established due diligence processes for identifying and addressing risk on both fronts are detailed in the Report. We believe that the Report covers each of the elements requested in the shareholder resolution. Honeywell maintains a world-class health, safety, and environmental program to identify and address the environmental and social impact of our operations on the surrounding communities and ensure compliance with regulatory standards. Our Health, Safety, Environmental, Product Stewardship and Sustainability Management practices (HSEMS) are managed by a global team of more than 800 trained professionals with extensive knowledge and hundreds of years of collective experience. We apply third-party-certified standards, including ISO 14001 and OHSAS 18001, and industry best practices, which are fully integrated into our operating system. Each of our facilities operates under a Plan-Do-Check-Act management system for identifying and addressing the potential environmental and social impacts of our operations and ensures compliance with regulatory standards: •Plan. 360 degree assessment of all aspects of the operation that could result in environmental or social harm. The assessment requires engagement with internal and external stakeholders, including employees and community members. •Do. Implement training, internal and external communication, actions, operational controls, emergency preparedness, and response planning to ensure that the facility and its stakeholders have the competency needed to address impacts and ensure compliance. •Check. Conduct self-assessments, audits, and management reviews to evaluate activities taken to plan for and control potential environmental or social harm. •Act. Requirement to address all findings by developing and tracking corrective actions and regularly review the HSEMS program for potential improvements. Details requested in the proposed resolution about how we identify and address environmental and social risks, including the types and extent of stakeholder consultation and our plans for tracking effectiveness of measures to assess, prevent, mitigate, and remedy adverse impacts on the environment and human health, are available in the Report. Of the matters explicitly cited in the proponent’s supporting statement, all but one stem from legacy operations unrelated to Honeywell’s current business; Honeywell has proactively worked to identify legacy properties where restoration may be required and engages with local governments and the surrounding communities to responsibly address these matters. With a legacy that dates back to the 19th century and roots in the chemical industry, we have environmental remediation obligations arising out of past operations, mostly in predecessor businesses or in operations that Honeywell closed years ago. Honeywell has proactively worked to identify these legacy properties, and we are responsibly addressing the issues we found. Honeywell’s proactive measures to restore these properties has been widely praised, and is not a reflection on current operations. Where practicable, we seek to transform those properties into new community assets. The Report available at investor.honeywell.com (see “ESG/ESG Information”) includes details about the sites referenced in the shareowner proposal. Honeywell has spent more than $4 billion over the last 18 years to remediate and restore legacy sites to productive community use. Using cutting-edge science, design, and engineering to protect human health and the environment, the Company works cooperatively with governments and engages with local communities and other external stakeholders to implement effective solutions. Honeywell does not consider a clean-up complete until the legacy property has been transformed into a valuable asset for the surrounding community, whenever possible. For example: •Baltimore, Maryland. Former chemical plant was remediated and has become a new downtown community, Harbor Point. Harbor Point is now home to Exelon, a leading energy provider, Morgan Stanley, and Johns Hopkins Medicine. •Syracuse, New York. Allied Chemical, Honeywell’s predecessor, operated on the shores of Onondaga Lake for about 100 years, along with multiple other industries and public operations. At one point, the lake was considered the “Most Polluted Lake” in North America. About 1,800 acres of wetlands have already been restored and preserved and about 1.1 million native plants are being planted. More than 285 wildlife species are now calling these areas home, and more than 120 unique bird species have been identified in and around Onondaga Lake. | | | | | | | | | | 102 | | Notice and Proxy Statement | 2022 |
PROPOSAL 6: SHAREOWNER PROPOSAL—ENVIRONMENTAL AND SOCIAL DUE DILIGENCE •Jersey City, New Jersey. After clean-up, this former 95-acre waste site in Jersey City was purchased in January 2019 by the City of Jersey City for Bayfront, a live-work-play development with waterfront access and 20-plus acres of open space. •Buffalo River, New York. Honeywell served as the private sector lead to restore the “functionally dead” Buffalo River through a unique public-private partnership. The river has now become an environmental, economic, and community resource. The river has re-emerged as an amenity and asset for landside redevelopment and renewal. •El Segundo, California. A former chemical and refrigerant plant has been redeveloped as two urban shopping centers. The Honeywell team went beyond the state’s remediation requirements to facilitate the planned commercial development. Within three years of manufacturing shutdown, city officials cut the ribbon on Plaza El Segundo, a Mediterranean-style shopping center with more than 50 shops and 423,000 square feet of commercial space. •Chicago, Illinois. The site was a former Celotex roofing tar and asphalt plant. As successor to Celotex, Honeywell engaged with residents in the surrounding neighborhood to convert the site into the green space envisioned by the community. The site is now a 22-acre community green space, including sports fields, basketball courts, a skate park, trails, and a large playground. For more information about Honeywell’s revitalization of brownfields while renewing communities, please visit the Company’s website at investor.honeywell.com (see “ESG/ESG Information”). | | | | | | | | | THE BOARD OF DIRECTORS UNANIMOUSLY RECOMMENDS A VOTE AGAINST THIS PROPOSAL. | | | |
| | | | | | | | | | | | | Notice and Proxy Statement | 2022 | | 103 |
The Board knows of no other matters to be presented for shareowner action at the meeting. If other matters are properly brought before the meeting, the persons named as proxies in the accompanying proxy card intend to vote the shares represented by them in accordance with their best judgment.
CERTAIN RELATIONSHIPS AND RELATED TRANSACTIONS Honeywell has written policies and procedures for approval or ratification of related person transactions. Article eight of Honeywell’s Amended and Restated Certificate of Incorporation provides that a related or interested party transaction shall not be void or voidable if such transaction is duly authorized or ratified by a majority of the disinterested members of the Board. Consistent with SEC rules, a related or interested party transaction includes a transaction between the Company and a director, director nominee or executive officer of the Company or a beneficial owner of more than 5% of the Company’s common stock or any of their respective immediate family members. Furthermore, the Honeywell Code of Business Conduct requires that each director and executive officer report to the Board of Directors on an ongoing basis any relationship or transaction that may create or appear to create a conflict between the personal interests of those individuals (or their immediate family members) and the interests of the Company. A conflict, or appearance of a conflict, might arise, for example, by accepting gifts or loans from a current or potential customer, supplier or competitor, owning a financial interest in, or serving in a business capacity with, an outside enterprise that competes with or does or wishes to do business with the Company, serving as an intermediary for the benefit of a third party in transactions involving the Company, or using confidential Company information or other corporate assets for personal profit. If a conflict
Conflict of interest or related party transaction is of a type or a nature that falls within the scope of oversight of a particular Board committee, it istransactions are referred to that committeethe CGRC which is responsible for review.reviewing and overseeing related party transactions for potential conflict of interest situations on an ongoing basis, as appropriate. The Board orCGRC and the responsible committeeBoard must review any potential conflict and determine whether any action is required. This includes whether to authorize, ratify or direct the unwinding of the relationship or transaction under consideration, as well as ensure that appropriate controls are in place to protect Honeywell and its shareowners. In making that determination, the Board or responsible committee considersand CGRC consider all relevant facts and circumstances, such as: •The benefits of the transaction to Honeywell; •The terms of the transaction and whether they are arm’s-length and in the ordinary course of the Company’s business; •The direct or indirect nature of the related person’s interest in the transaction; •The size and expected term of the transaction; and •Other facts and circumstances that bear on the materiality of the related person transaction under applicable law and listing standards. Each director and officer also completes and signs a questionnaire at the end of each fiscal year to confirm that there are no material relationships or related person transactions between such individuals and the Company other than those previously disclosed to Honeywell. This ensures that all material relationships and related person transactions are identified, reviewed and disclosed in accordance with applicable policies, procedures and regulations. There are no family relationships among any of our directors or executive officers. | | | | | | | | | 91
104 | |
| | | |Notice and Proxy Statement | 2021
| | | 2022 |
| | | 10 | | | ADDITIONAL
INFORMATION
|
STOCK OWNERSHIP INFORMATION I
FIVE PERCENT OWNERS OF COMPANY STOCK The following table lists information about those holders known to Honeywell to be the beneficial owners of 5% or more of our outstanding shares of common stock as of December 31, 2020. | | | | | | | | | | | | | | | | | | Name and
Complete Mailing Address
| | Number
of Shares
| | | Percent of
Common Stock
Outstanding(3)
| | | | | | | | | | | The Vanguard Group
100 Vanguard Blvd., Malvern, PA 19355
| | | 51,440,932(1)
| | | | 7.41%
| | BlackRock, Inc.
55 East 52nd Street, New York, NY 10055
| | | 42,835,736(2)
| | | | 6.17%
| |
(1) | The information is based on a Schedule 13G/A filed by The Vanguard Group with the SEC on February 10, 2021. The Vanguard Group and certain related entities have shared voting power in respect of 1,096,185 shares, sole dispositive power in respect of 48,471,490 shares, and shared dispositive power in respect of 2,969,442 shares.
|
(2) | The information is based on a Schedule 13G/A filed by BlackRock, Inc. with the SEC on January 29, 2021. BlackRock, Inc. and certain related entities have sole voting power in respect of 38,218,225 shares and sole dispositive power in respect of 42,835,736 shares.
|
(3) | Based on 694,494,976 shares of common stock outstanding on March 15, 2021.
|
2021. | | | | | | | | | | | | | Name and Complete Mailing Address | Number of Shares | Percent of Common Stock Outstanding(3) | The Vanguard Group 100 Vanguard Blvd., Malvern, PA 19355 | 56,119,426 | (1) | 8.18% | BlackRock, Inc. 55 East 52nd Street, New York, NY 10055 | 41,185,153 | (2) | 6.0% |
I(1)The information is based on a Schedule 13G/A filed by The Vanguard Group with the SEC on February 10, 2022. The Vanguard Group and certain related entities have shared voting power in respect of shares, sole dispositive power in respect of 53,441,485 shares, and shared dispositive power in respect of 2,677,941 shares.
(2)The information is based on a Schedule 13G/A filed by BlackRock, Inc. with the SEC on February 7, 2022. BlackRock, Inc. and certain related entities have sole voting power in respect of 36,500,366 shares and sole dispositive power in respect of 41,185,153 shares. (3)Based on 685,894,421 shares of common stock outstanding on February 15, 2022. STOCK OWNERSHIP OF DIRECTORS AND EXECUTIVE OFFICERS The following table lists information as of MarchFebruary 15, 2021,2022, about the beneficial ownership of common stock by each director or director nominee, by each executive officer named in the Summary Compensation Table, and by all directors (including nominees) and executive officers of Honeywell as a group. Beneficial ownership is determined according to the rules of the SEC, and generally means that a person has beneficial ownership of a security if he, she, or it possesses sole or shared voting or investment power of that security, including options that are currently exercisable or exercisable within 60 days of February 15, 2022. Except as otherwise noted,indicated by the individuals listedfootnotes below, we believe, based on the information furnished to us, that the persons named in the following table below have sole voting and investment power with respect to all shares of common stock shown that they beneficially own, subject to community property laws where applicable. The information does not necessarily indicate beneficial ownership for any other purpose. Shares of our common stock that are subject to options currently exercisable or exercisable within 60 days of February 15, 2022 are deemed to be outstanding for computing the sole power to vote or transferpercentage ownership of the shares reflectedperson holding these options and the percentage ownership of any group in which the table. | | | | | | | | | | | | | | | | | | | | | | | | | | | | | | | | | | | | | | Components of Beneficial
Ownership (Number of Shares) | | | | | | | | | | | | | | | | | | | | | | | | | | | | | | | | | | | | | | | Name(1) | | Common
Stock
Beneficially
Owned | | | Right To
Acquire(2) | | | Other
Stock- Based
Holdings(3) | | | Total Number
of Shares(4) | | | | | | | | | | | | | | | | | | | | Darius Adamczyk | | | 140,849 | | | | 1,105,196 | | | | 4,187 | | | | 1,250,232 | | Duncan B. Angove | | | — | | | | 4,193 | | | | 3,730 | | | | 7,923 | | William S. Ayer | | | 5,082 | | | | 13,640 | | | | 3,559 | | | | 22,281 | | Kevin Burke | | | 20,011 | | | | 21,664 | | | | 10,388 | | | | 52,063 | | D. Scott Davis | | | 24,955 | | | | 16,208 | | | | 19,682 | | | | 60,845 | | Linnet F. Deily | | | 7,509 | | | | 10,476 | | | | 17,696 | | | | 35,681 | | Deborah Flint | | | — | | | | 1,415 | | | | 1,521 | | | | 2,936 | | Judd Gregg | | | 14,532 | | | | 19,360 | | | | 15,593 | | | | 49,485 | | Clive Hollick | | | 17,499 | | | | 19,360 | | | | 25,951 | | | | 62,810 | | Grace D. Lieblein | | | 6,135 | | | | 19,360 | | | | 6,590 | | | | 32,085 | | Raymond T. Odierno | | | — | | | | 1,184 | | | | 1,248 | | | | 2,432 | | George Paz | | | 19,384 | | | | 22,432 | | | | 13,158 | | | | 54,974 | | Robin L. Washington | | | 6,115 | | | | 19,360 | | | | 9,142 | | | | 34,617 | | Gregory P. Lewis | | | 24,656 | | | | 173,567 | | | | 1,102 | | | | 199,325 | | Anne T. Madden | | | 30,105 | | | | 195,276 | | | | 39,940 | | | | 265,321 | | Rajeev Gautam | | | 13,244 | | | | 283,106 | | | | 2,885 | | | | 299,235 | | John F. Waldron | | | 37,065 | | | | 210,135 | | | | 936 | | | | 248,136 | | All directors, nominees and executive officers as a group, including the above-named persons (22 people) | | | 435,047 | | | | 2,468,138 | | | | 179,911 | | | | 3,083,096 | |
(1) | c/o Honeywell International Inc., 300 S. Tryon St., Suite 600, Charlotte, NC 28202.
|
(2) | Includes shares which the named individual or group has the right to acquire through the exercise of vested stock options and shares which the named individual or group has the right to acquire through the vesting of restricted stock units and stock options within 60 days of March 15, 2021.
|
(3) | Includes shares and/or share-equivalents in deferred accounts as to which no voting or investment power exists.
|
(4) | The total beneficial ownership for any individual and the total beneficial ownership for the group are both less than 1% of the shares of common stock outstanding as of March 15, 2021.
|
| | | | | | |
| | |Notice and Proxy Statement | 2021 2022
| | 92
105 |
| | | 10 | | | ADDITIONAL
INFORMATION
|
| | | | | | | | | | | | | | | | Components of Beneficial Ownership (Number of Shares) | | Name(1) | Common
Stock
Beneficially
Owned | Right to Acquire(2) | Other Stock-Based Holdings(3) | Total Number of Shares(4) | | Darius Adamczyk | 147,903 | 1,257,857 | 4,719 | 1,410,479 | | Duncan B. Angove | 862 | 3,341 | 4,581 | 8,784 | | William S. Ayer | 6,011 | 12,788 | 3,891 | 22,690 | | Kevin Burke | 22,056 | 18,508 | 10,805 | 51,369 | | D. Scott Davis | 25,817 | 15,356 | 20,216 | 61,389 | | Deborah Flint | 485 | 1,287 | 2,278 | 4,050 | | Judd Gregg | 15,485 | 18,508 | 16,785 | 50,778 | | Rose Lee | 9 | 0 | 267 | 276 | | Grace D. Lieblein | 8,411 | 15,356 | 6,731 | 30,498 | | George Paz | 20,251 | 21,580 | 13,610 | 55,441 | | Robin L. Washington | 10,175 | 15,356 | 10,015 | 35,546 | | Gregory P. Lewis | 31,518 | 212,043 | 1,296 | 244,857 | | Anne T. Madden | 32,006 | 228,515 | 40,343 | 300,864 | | Que Thanh Dallara | 6,302 | 108,726 | 597 | 115,625 | | Michael R. Madsen | 35,002 | 153,519 | 1,483 | 190,004 | | All directors, nominees and executive officers as a group, including the above-named persons (20 people) | 429,672 | 2,542,047 | 139,992 | 3,111,711 |
I(1) DELINQUENT SECTION 16(A) REPORTSSection 16(a)c/o Honeywell International Inc., 855 S. Mint Street, Charlotte, NC 28202.
(2)Includes shares which the named individual or group has the right to acquire through the exercise of vested stock options and shares which the named individual or group has the right to acquire through the vesting of Restricted Stock units and stock options within 60 days of February 15, 2022. (3)Includes shares and/or share-equivalents in deferred accounts as to which no voting or investment power exists. (4)The total beneficial ownership for any individual and the total beneficial ownership for the group are both less than 1% of the Exchange Act requiresshares of common stock outstanding as of February 15, 2022. VIRTUAL ANNUAL MEETING Considering ongoing COVID-19 safety concerns and our directors, executive officers, and persons who own more than 10% of our Common Stockpositive virtual meeting experience the last two years, the Board has chosen to file reports of ownership and changes in ownership of our Common Stock withhold the SEC. Based on the information available to us, we believe that in 2020, and to date in 2021, all applicable Section 16(a) reports were timely filed, except one Form 4 for Grace D. Lieblein and two Form 4s for Robin L. Washington, each of which was related to deferred compensation (Phantom Shares) transactions and was filed late due to administrative errors. In 2021, Vimal Kapur late reported on Form 4 two purchases (totaling 18 shares) and one sale (2 shares) that were transacted in 2019 on his behalf by his investment managerCompany’s Annual Meeting in a managed account withoutvirtual format again this year. Last year, Honeywell’s Chairman and CEO led the meeting and used the platform to speak directly to shareowners about Honeywell’s leadership through the COVID-19 pandemic. The proponent of the one shareowner proposal had a choice between presenting his knowledgestatements live by dialing in to the meeting or approval.providing a pre-recorded message, and shareowners also had an opportunity to submit questions both before and during the meeting. Honeywell’s Chairman and CEO answered most of the questions during the time allotted for Q&A. We responded to appropriately submitted, but unanswered, questions in writing by posting the questions and answers on our Investor Relations website after the meeting. In comparison to typical in-person meetings, the Company believes the virtual format enables more meaningful engagement and a greater level of information sharing with a broader group of shareowners. See “Participation in the Annual Meeting” below for additional information regarding attending our virtual Annual Meeting. The SEC’s “Notice and Access” rule allows companies to deliver a Notice of Internet Availability of Proxy Materials (Notice of Internet Availability) to shareowners in lieu of a paper copy of the Proxy Statement and related materials and the Company’s Annual Report to Shareowners (Proxy Materials). The Notice of Internet Availability provides instructions as to how shareowners can access the Proxy Materials online, contains a listing of matters to be considered at the meeting, and sets forth instructions as to how shares can be voted. Instructions for requesting a paper copy of the Proxy Materials are set forth on the Notice of Internet Availability.  Proxy Materials are Available at www.proxyvote.com.You will need to enter the 16-digit control number located on the Notice of Internet Availability or proxy card. Proxy Materials are Available at www.proxyvote.com.You will need to enter the 16-digit control number located on the Notice of Internet Availability or proxy card. |
| | | | | | | | | 106 | | Notice and Proxy Materials are Available at www.proxyvote.com. You will need to enter the 16-digit control number located on the Notice of Internet Availability or proxy card.Statement | 2022 |
Shareowners of Record.If your shares are registered directly in your name with Honeywell’s transfer agent, EQ Shareowner Services, you are considered the shareowner of record of those shares. Shareowners of record can vote via the Internet at www.proxyvote.com, by scanning the QR code with a mobile device, by calling +1 (800) 690-6903, or by signing and returning a proxy card. Votes submitted by Internet, mobile device, or telephone must be received by 11:59 p.m. EDT on May 20, 2021.April 24, 2022. If you indicate when voting online or by phone that you wish to vote as recommended by the Board, or sign and return a proxy card without giving specific voting instructions, then the persons named as proxy holders will vote your shares in the manner recommended by the Board on all matters presented in this Proxy Statement and as they may determine in their best judgment with respect to any other matters properly presented for a vote at the Annual Meeting. Beneficial Owners.If your shares are held in a stock brokerage account by a bank, broker, trustee, or other nominee, you are considered the beneficial owner of shares held in street name and these Proxy Materials are being forwarded to you by your bank, broker, trustee or nominee who is considered the shareowner of record of those shares. As the beneficial owner, you have the right to direct your bank, broker, trustee or nominee on how to vote via the Internet or by telephone or mobile device if the bank, broker, trustee or nominee offers these options or by signing and returning a proxy card. Your bank, broker, trustee or nominee will send you instructions for voting your shares. NYSE rules prohibit brokersIf you do not provide the bank, broker, trustee, or other nominee that holds your shares with specific voting instructions, then such bank, broker, trustee, or other nominee may generally vote your shares in their discretion on “routine” matters, but cannot vote on “non-routine” matters. Proposal No. 3, the approval of the appointment of Deloitte, is considered a routine matter; because a bank, broker, trustee or other nominee may generally vote in their discretion on routine matters, no broker non-votes are expected in connection with Proposal No. 3. The following proposals are considered non-routine matters: Proposal No. 1, election of directors; Proposal No. 2, advisory vote to approve executive compensation; and Proposal Nos. 4 through 6, which are shareowner proposals. If the bank, broker, trustee or other nominee that holds your shares does not receive instructions from votingyou on how to vote your shares on a non-routine matter, it will inform the inspector of election that it does not have the authority to vote on the matter with respect to your shares, which is generally referred to as a “broker non-vote.” Accordingly, broker non-votes may exist in connection with Proposal Nos. 1, 2 and 4 without receiving instructions from the beneficial owner of the shares.through 6. In the absence of instructions, shares subject to such broker non-votes will not be counted as voted or as present or represented on those proposals and so will have no effect on the vote.Brokers
As described above, brokers may not vote your shares on the election of directors in the absence of your specific instructions as to how to vote, so we encourage you to provide instructions to your broker regarding the voting of your shares. Votes directed by Internet, mobile device or telephone through such a bank, broker, trustee or nominee must be received by 11:59 p.m. EDT on May 20, 2021.April 24, 2022. Participants in Honeywell Savings Plans.Participants in Honeywell stock funds within Honeywell savings plans are considered the beneficial owners of the shares held by the savings plans. The trustee of each savings plan is the shareowner of record for shares held by Honeywell stock funds within that plan. Participants in Honeywell stock funds within Honeywell savings plans can direct the trustee of the relevant plan to vote their shares via the Internet at www.proxyvote.com, by scanning the QR Code with a mobile device, by calling +1 (800) 690-6903, or by signing and returning a proxy card.The
Each trustee will vote shares as to which no directions are received in the same ratio as shares with respect to which directions have been received from other participants in the relevant plan, unless contrary to the Employee Retirement Income Security Act of 1974 (ERISA). We encourage you to provide instructions to the relevant trustee regarding the voting of your shares. Directions provided by Internet, mobile device, or telephone must be received by 5:00 p.m. EDT on May 18, 2021. | Your Vote is Very Important to us. Whether or not you plan to attend the meeting, please take the time to vote your shares as soon as possible.
|
April 21, 2022. IYour Vote is Very Important to us. Whether or not you plan to attend the meeting, please take the time to vote your shares as soon as possible.CONFIDENTIAL VOTING POLICY It is our policy that any proxy, ballot or other voting material that identifies the particular vote of a shareowner and contains the shareowner’s request for confidential treatment will be kept confidential, except in the event of a contested proxy solicitation or as may be required by law. | | | | | | | | | 93
| |
| | | | Notice and Proxy Statement | 2021
| | | |
| | | 10 | | | ADDITIONAL
INFORMATION
|
We may be informed whether or not a particular shareowner has voted and will have access to any comment written on a proxy, ballot or other material and to the identity of the commenting shareowner. Under the policy, the inspectors of election at any shareowner meeting will be independent parties unaffiliated with Honeywell.
I
| | | | | | | | | | | | | Notice and Proxy Statement | 2022 | | 107 |
Whether you vote or direct your vote by mail, telephone, mobile device, or via the Internet, if you are a shareowner of record or a participant in Honeywell stock funds within Honeywell savings plans, unless otherwise noted, you may later revoke your proxy by: •Sending a timely written statement to that effect to the Corporate Secretary of Honeywell; •Submitting a properly signed proxy with a later date; •Voting by telephone, mobile device or via the Internet at a later time (if initially able to vote in that manner) so long as such vote or voting direction is received by the applicable date and time set forth above for shareowners of record and participants in Honeywell savings plans; or •Voting at the Annual Meeting (except for shares held in the savings plans). If you hold your shares through a bank, broker, trustee, or nominee and you have instructed the bank, broker, trustee, or nominee to vote your shares, you must follow the directions received from your bank, broker, trustee, or nominee to change those instructions. I
QUORUM; VOTE REQUIRED; ABSTENTIONS AND BROKER NON-VOTES The required quorum for the transaction of business at the meeting is a majority of the total outstanding shares of common stock entitled to vote at the meeting, either present in person (virtually) or represented by proxy. Broker non-votes and abstentions are counted for purposes of determining whether a quorum is present. Regarding Proposal No. 1, Honeywell’s By-laws provide that in any uncontested election of directors (an election in which the number of nominees does not exceed the number of directors to be elected), any nominee who receives a greater number of votes cast “FOR” his or her election than votes cast “AGAINST” his or her election (excluding abstentions) will be elected to the Board of Directors. Shares not represented in person or by proxy at the Annual Meeting, abstentions and broker non-votes will have no effect on the election of directors. The affirmative vote of a majority of shares present or represented and entitled to vote on each of Proposal Nos. 2 through 46 is required for approval of these proposals. Abstentions will be counted toward the tabulation of votes present or represented on these proposals and will have the same effect as votes against these proposals. Shares not represented in person or by proxy at the Annual Meeting and broker non-votes will have no effect on the vote outcome of these proposals. While the votevotes on ProposalProposals No. 2 isand 3 are advisory and not binding on the Board or the Company, the Board or applicable committee will take into consideration the outcome of the votes when making future decisions regarding executive compensation.Icompensation and the auditor appointment, respectively.
We will announce preliminary voting results at the Annual Meeting and publish them on our Investor Relations website at investor.honeywell.com. Voting results will also be disclosed on a Form 8-K filed with the SEC within four business days after the Annual Meeting, which will be available on the same website. I
At the close of business on March 26, 2021,February 25, 2022, there were 694,538,006685,481,704 shares of common stock outstanding. Each share outstanding as of the March 26, 2021,February 25, 2022 record date is entitled to one vote at the Annual Meeting on each matter properly brought before the meeting. I
ELIMINATING DUPLICATE MAILINGS Beneficial owners of common stock who share a single address will receive only one copy of the Notice of Internet Availability or the Proxy Materials, as the case may be, unless their broker, bank, trustee or nominee has received contrary instructions from any beneficial owner at that address. This practice, known as “householding,” is designed to reduce printing and mailing costs. If any beneficial shareowner(s) sharing a single address wish to discontinue householding and receive a separate copy of the Notice of Internet Availability or the Proxy Materials, as the case may be, we will have a separate copy promptly delivered to you upon your written or oral request. To make the request, they may contact Broadridge, either by calling +1 (866) 540-7095, or by writing to Broadridge, Householding Department, 51 Mercedes Way, Edgewood, NY 11717.I11717 and including their name, the name of their broker or other nominee and their account number(s). Beneficial owners may also contact Broadridge if they received multiple copies of the proxy materials and prefer to receive a single copy in the future.
| | | | | | | | | | 108 | | Notice and Proxy Statement | 2022 |
Honeywell pays the cost of preparing, assembling, and mailing this proxy-soliciting material. In addition to the use of the mail, proxies may be solicited by Honeywell officers and employees by telephone or other means of communication. Honeywell pays all costs of solicitation, including certain expenses of brokers and nominees who mail Proxy Materials to their customers or principals. We have not yet retained, but may retain, a proxy solicitor in conjunction with the Annual Meeting, and its employees may assist us in the solicitation. We will pay all costs of soliciting proxies, including a fee and reasonable out-of-pocket expenses for the proxy solicitor, if any. | | | | |
| | | Notice and Proxy Statement | 2021
| | 94
|
| | | 10 | | | ADDITIONAL
INFORMATION
|
IELECTRONIC ACCESS TO THE PROXY MATERIALS
You can elect to receive future Proxy Materials by email, which will save us the cost of producing and mailing documents to you. Shareowners may enroll to receive Proxy Materials electronically as follows: | Shareowners of Record. If you are a registered shareowner, you may request electronic delivery when submitting your vote for this meeting on the Internet at www.proxyvote.com.
|
| Beneficial Holders. If your shares are not registered in your name, check the information provided to you by your bank or broker, or contact your bank or broker for information on electronic delivery service.
|
Shareowners of Record.If you are a registered shareowner, you may request electronic delivery when submitting your vote for this meeting on the Internet at www.proxyvote.com. Beneficial Holders.If your shares are not registered in your name, check the information provided to you by your bank or broker, or contact your bank or broker for information on electronic delivery service. PARTICIPATION IN THE ANNUAL MEETING We will be hosting the Annual Meeting in a virtual-only format. Due to the success of our past virtual shareowner meetings, the ongoing public health impact of COVID-19, and to support the health and well-being of our shareowners, employees and communities, there will not be an in-person meeting. Any shareowner can instead listen to and participate in, and vote at, the Annual Meeting live via the Internet at www.virtualshareholdermeeting.com/ HON2021,HON2022, and a transcript of the meeting will be posted after the meeting on our Investor Relations website at investor.honeywell.com. After the Annual Meeting, we will spend up to 30 minutes answering shareowner questions that comply with our Annual Meeting rules of conduct. The questions and responses will be included in the meeting transcript. Shareowners may submit questions before the meeting through www.proxyvote.com and during the meeting through the virtual Annual Meeting web portal. We will respond to appropriately submitted, but unanswered, questions in writing by posting the questions and answers on our Investor Relations website soon after the meeting. The Annual Meeting webcast will begin promptly at 10: 30a.m.30 a.m. EDT. We encourage you to access the Annual Meeting portal prior to the start time. Online check-in will begin approximately 15 minutes prior to the start of the Annual Meeting on April 25, 2022.Even if you plan on attending the Annual Meeting, we encourage you to vote your shares in advance using one of the methods described in this Proxy Statement to ensure that your vote will be represented at the Annual Meeting. Materials Needed to Participate in Annual Meeting.You will need the 16-digit control number included on your Notice of Internet Availability, proxy card or voting instruction form (if you received a printed copy of the Proxy Materials) or included in the email to you (if you received your proxy materials by email) in order to access the meeting, vote your shares and submit questions. If you do not have your control number, you will not be able to attend, vote your shares, or submit questions before or during the Annual Meeting. Please contact Honeywell Investor Relations at investorrelations@honeywell.com for assistance if you are unable to locate your control number. Technical Assistance.There will be technicians ready to assist you with any technical difficulties you may have when trying to access the meeting or submitting questions during the meeting. If you encounter any difficulties accessing the virtual Annual Meeting during the check-in or meeting time, please call the technical support number that will be posted on the Virtual Annual Meeting log in page. | Materials Needed to Participate in Annual Meeting. You will need the 16-digit control number included on your
| | | | | | | | | | | | Notice of Internet Availability, proxy card or voting instruction form (if you received a printed copy of theand Proxy Materials) or included in the email to you (if you received your proxy materials by email) in order to access the meeting, vote your shares or submit questions. If you do not have your control number, you will not be able to attend, vote your shares, or submit questions before or during the Annual Meeting. Please contact Honeywell Investor Relations at investorrelations@honeywell.com for assistance if you are unable to locate your control number.Statement | 2022 | | 109 |
| Technical Assistance. There will be technicians ready to assist you with any technical difficulties you may have when trying to access the meeting or submitting questions during the meeting. If you encounter any difficulties accessing the virtual Annual Meeting during the check-in or meeting time, please call the technical support number that will be posted on the Virtual Annual Meeting log in page.
|
SHAREOWNER PROPOSALS AND BOARD NOMINEES I
SHAREOWNER PROPOSALS FOR 20222023 ANNUAL MEETING In order for a shareowner proposal to be considered for inclusion in Honeywell’s Proxy Statement for the 20222023 Annual Meeting of Shareowners pursuant to Rule 14a-8 of the SEC, the proposal must be received at the Company’s offices no later than the close of business on December 11, 2021.November 15, 2022. Proposals submitted thereafter will be opposed as not timely filed. If a shareowner intends to present a proposal for consideration at the 20222023 Annual Meeting of Shareowners pursuant to the procedures contemplated in Honeywell’s By-laws, outside the processes of SEC Rule 14a-8 or the proxy access provisions in Honeywell’s By-laws, Honeywell must receive notice of such proposal not earlier than January 21,December 26, 2022, and not later than February 20, 2022.January 25, 2023. Otherwise, the proposal will be considered untimely under Honeywell’s By-laws. The notice must contain a brief description of the proposal, the reasons for conducting such business, the name and address of the shareowner, the number of shares of Honeywell’s common stock the shareowner beneficially owns, and any material interest of the shareowner in such business, all as provided in Honeywell’s By-laws. If this information is not supplied as provided in Honeywell’s By-laws,Bylaws, the proposal will not be considered at the 20222023 Annual Meeting of Shareowners. In addition, Honeywell’s proxies will have discretionary voting authority on any vote with respect to such proposal, if presented at the meeting, without including information regarding the proposal in its Proxy Materials. Any shareowner wishing to submit a shareowner proposal should send notice to: Corporate Secretary, Honeywell, 300855 S. TryonMint Street, Suite 600, Charlotte, NC 28202.28202 and honcorpsec@honeywell.com. | | | | | | | | | 95
| |
| | | | Notice and Proxy Statement | 2021
| | | |
| | | 10 | | | ADDITIONAL
INFORMATION
|
IDIRECTOR NOMINATIONS FOR 20222023 ANNUAL MEETING
Proxy Access Nominations.Honeywell’s By-laws allow a single shareowner or a group of up to 20 shareowners who have held at least 3% of Honeywell stock for at least three years to submit director nominees (the greater of 20% of the Board or two directors) for inclusion in Honeywell’s Proxy Statement if the shareowner(s) and the nominee(s) satisfy the requirements specified in Honeywell’s By-laws. Notice must be received by the Corporate Secretary of Honeywell at 300855 S. TryonMint Street, Suite 600, Charlotte, NC 28202 not earlier than the 150thclose of business on the 150th day and not later than the close of business on the 120th day prior to the first anniversary of the date the definitive Proxy Statement was first released to shareowners in connection with the preceding year’s Annual Meeting. Honeywell did not receive any such nominations for the 20212022 Annual Meeting of Shareowners.
Non-Proxy Access Nominations.Honeywell’s By-laws state that any shareowner of record entitled to vote at the Annual Meeting who intends to make a nomination for director must notify the Corporate Secretary in writing not more than 120 days and not less than 90 days prior to the first anniversary of the preceding year’s Annual Meeting. The notice must meet other requirements contained in the By-laws, a copy of which can be obtained from the Corporate Secretary. Honeywell did not receive any such nominations for the 20212022 Annual Meeting of Shareowners.
Universal Proxy Rules. To comply with the universal proxy rules (once effective), shareowners who intend to solicit proxies in support of director nominees other than Honeywell’s nominees must provide notice that sets forth the information required by Rule 14a-19 under the Exchange Act no later than February 24, 2023. Such notice may be mailed to the Corporate Secretary at the address above and emailed to honcorpsec@honeywell.com. Shareowner Recommendations.Shareowners wishing to recommend a director candidate to the CGRC for its consideration should write to the CGRC, in care of Corporate Secretary, Honeywell, 300855 S. TryonMint Street, Suite 600, Charlotte, NC 28202. To receive meaningful consideration, a recommendation should include the candidate’s name, biographical data, and a description of his or her qualifications in light of the criteria described in this Proxy Statement. The CGRC evaluates candidates recommended by shareowners using the same criteria as for other candidates recommended by existing Board members or other persons, as described above under “Nomination and Election Process”. | | | | | | | | | | 110 | | Notice and Proxy Statement | 2022 |
WHERE SHAREOWNERS CAN FIND MORE INFORMATION I
Our Annual Report on Form 10-K, Quarterly Reports on Form 10-Q, Current Reports on Form 8-K, and any amendments to those reports, are available free of charge on our website at investor.honeywell.com (see “SEC“Financials/SEC Filings”) immediately after they are publicly filed or furnished. I
CORPORATE GOVERNANCE DOCUMENTS Please visit our website at honeywell.cominvestor.honeywell.com (see “Investors/Corporate Governance”“Governance/Governance Overview”) to view our governance documents, including our Charter and By-laws, Corporate Governance Guidelines, Code of Business Conduct, and Board committee charters. I
COMMUNICATING WITH MANAGEMENT AND INVESTOR RELATIONS Our Investor Relations department is the primary point of contact for shareowner interaction with Honeywell. Shareowners should write to or call: Vice President, Investor Relations, Honeywell, 300855 S. TryonMint Street, Suite 600, Charlotte, NC 28202 or +1 (704) 627-6200. I
COMMUNICATING WITH THE BOARD Shareowners, as well as other interested parties, may communicate directly with our Lead Director, for an upcoming meeting, the non-employee directors as a group, or individual directors by writing to: Corporate Secretary, Honeywell, 300855 S. TryonMint Street, Suite 600, Charlotte, NC 28202. Honeywell’s Corporate Secretary reviews and promptly forwards communications to the directors as appropriate. Communication involving substantive accounting or auditing matters are forwarded to the Audit Committee Chair. Certain items that are unrelated to the duties and responsibilities of the Board will not be forwarded such as: business solicitation or advertisements; product or service related inquires; junk mail or mass mailings; resumes or other job-relatedjob‑related inquires; spam; and overly hostile, threatening, potentially illegal or similarly unsuitable communications. I
Honeywell uses our Investor Relations website, investor.honeywell.com, as a means of disclosing information which may be of interest or material to our investors and for complying with disclosure obligations under Regulation FD. Accordingly, investors should monitor our Investor Relations website, in addition to following our press releases, SEC filings, public conference calls, webcasts, and social media. We encourage our shareowners to visit our website for more information about our financial, corporate governance, corporate responsibility and sustainability policies, practices, and performance. | Visit Our Website at investor.honeywell.com.
|
Visit Our Website at investor.honeywell.com. Although we include references to our website throughout this Proxy Statement, information contained on or accessible through, including any reports available on, our website is not a part of, and is not incorporated by reference into, this Proxy Statement or any other report or document we file with the Securities and Exchange Commission. Any reference to our website throughout this Proxy Statement is intended to be an inactive textual reference only. No assurance can be given that any plan, initiative, projection, goal, commitment, expectation, or prospect set forth in this Proxy Statement can or will be achieved. Inclusion of information in this Proxy Statement is not an indication that the subject or information is material to our business or operating results. By Order of the Board of Directors, 
Victor
Vice President, Deputy General Counsel, Corporate Secretary, and Chief Compliance Officer April 9, 2021
March 15, 2022 | | | | | | | | | | | |
| | |Notice and Proxy Statement | 2021 2022
| | 96
111 |
| | | A-1 | | | APPENDIX A:
RECONCILIATION OF NON-GAAP FINANCIAL MEASURES
|
APPENDIX A: RECONCILIATION OF
NON-GAAP FINANCIAL MEASURES
(1) Reconciliation of Cash Provided by Operating Activities to Adjusted Free Cash Flow | | | | | | | | | | | | | | | | | | | ($M) | | 2019 | | | 2020 | | | | | | | | | | | Cash provided by operating activities | | $ | 6,897 | | | $ | 6,208 | | Expenditures for property, plant and equipment | | | (839 | ) | | | (906 | ) | | | | | | | | | | Free cash flow | | | 6,058 | | | | 5,302 | | Separation cost payments | | | 213 | | | | — | | | | | | | | | | | Adjusted free cash flow | | $ | 6,271 | | | $ | 5,302 | | | | | | | | | | | | | | | | | | | | |
| | | | | | | | | | | | | | | | ($M) | 2020 | 2021 | | Cash provided by operating activities | $ | 6,208 | $ | 6,038 | | | Expenditures for property, plant, and equipment | | (906) | | (895) | | | Garrett Cash Receipts | | — | | | 586 | | Free cash flow | $ | 5,302 | | 5,729 | |
We define free cash flow as cash provided by operating activities less cash expenditures for property, plant, and equipment.equipment plus cash receipts from Garrett. We believe that thisfree cash flow is a non-GAAP metric that is useful to investors and management as a measure of cash generated by business operations that will be used to repay scheduled debt maturities and can be used to invest in future growth through new business development activities or acquisitions, pay dividends, repurchase stock or repay debt obligations prior to their maturities. This metric can also be used to evaluate our ability to generate cash flow from business operations and the impact that this cash flow has on our liquidity. (2) Reconciliation of EPS to Adjusted EPS | | | | | | | | | | | | | | | | | | | | | | | | | | | | | | 2017 | | | 2019 | | | 2020 | | | | | | | | | | | | | | | Earnings per share of common stock—assuming dilution(1) | | $ | 2.00 | | | $ | 8.41 | | | $ | 6.72 | | Pension mark-to-market expense(2) | | | 0.09 | | | | 0.13 | | | | 0.04 | | Separation costs(3) | | | 0.02 | | | | — | | | | — | | Separation related tax adjustment(4) | | | — | | | | — | | | | (0.26 | ) | Impacts from U.S. Tax Reform | | | 5.04 | | | | (0.38 | ) | | | | | Garrett related adjustment(5) | | | — | | | | — | | | | 0.60 | | | | | | | | | | | | | | | Adjusted earnings per share of common stock—assuming dilution | | $ | 7.15 | | | $ | 8.16 | | | $ | 7.10 | | | | | | | | | | | | | | | | | | | | | | | | | | | | |
(1) | Utilizes weighted average shares of 772.1 million, 730.3 million, 711.2 million in 2017, 2019, 2020.
|
(2) | Pension mark-to-market expense uses a blended tax rate of 23%, 24%, 25% in 2017, 2019, 2020.
|
(3) | Represents separation costs including net tax impacts of $14 million.
|
(4) | Represents a separation-related tax adjustment of $186 million ($186 million net of tax) resulting from the favorable resolution of a foreign tax matter related to the spin-off transactions.
|
(5) | Represents a $427 million adjustment net of tax due to the non-cash charges associated with the reduction in value of reimbursement receivables due from Garrett, net of proceeds from settlement of related hedging transactions.
|
| | | | | | | | | | | | | | | | | | | | | | | | | | | | 2018 | 2019 | 2020 | 2021 | Earnings per share of common stock—assuming dilution(1) | $ | 8.98 | $ | 8.41 | $ | 6.72 | $ | 7.91 | Pension mark-to-market expense(2) | | 0.04 | | 0.13 | | 0.04 | | 0.05 | Separation related tax adjustment(3) | | — | | | — | | | (0.26) | | — | | Changes in fair value for Garrett equity securities(4) | | — | | | — | | | — | | | (0.03) | | Garrett related adjustment(5) | | — | | | — | | | 0.60 | | 0.01 | | Impacts from U.S. Tax Reform | | (1.98) | | | (0.38) | | | — | | | — | | Gain on sale of retail footwear business(6) | | — | | | — | | | — | | | (0.11) | | Expense related to UOP Matters(7) | | — | | | — | | | — | | | 0.23 | Separation costs(8) | | 0.97 | | | — | | | — | | | — | | | Adjusted earnings per share of common stock—assuming dilution | $ | 8.01 | $ | 8.16 | $ | 7.10 | $ | 8.06 | | Less: EPS, attributable to spin-offs | | 0.62 | | — | | | — | | | — | | | Adjusted earnings per share of common stock - assuming dilution, excluding spin-off impact | $ | 7.39 | $ | 8.16 | $ | 7.10 | $ | 8.06 |
(1)For the twelve months ended December 31, 2021. 2020, 2019 and 2018, adjusted earnings per share utilizes weighted average shares of approximately 700.4 million 711.2 million, 730.3 million and 753.0 million. (2)Pension mark-to-market expense uses a blended tax rate of 24%, 24%, 25%, and 25% in 2018, 2019, 2020, and 2021. (3)For the twelve months ended December 31, 2020, separation-related tax adjustment of $186 million ($186 million net of tax) includes the favorable resolution of a foreign tax matter related to the spin-off transactions. (4)For the twelve months ended December 31, 2021, the adjustment was $19 million net of tax due to changes in fair value for Garrett equity securities. (5)For the twelve months ended December 31, 2021, the adjustment was $7 million net of tax due to a non-cash charge associated with a further reduction in value of reimbursement receivables following Garrett's emergence from bankruptcy on April 30, 2021. For the twelve months ended December 31, 2020, the adjustment was $427 million net of tax due to the non-cash charges associated with the reduction in value of reimbursement receivables due from Garrett, net of proceeds from settlement of related hedging transactions. (6)For the twelve months ended December 31, 2021, the adjustment was $76 million net of tax due to the gain on sale of the retail footwear business. (7)For the twelve months ended December 31, 2021, the adjustment was $160 million with no tax benefit due to an expense related to UOP matters. (8)For the twelve months ended December 31, 2018, separation costs of $732 million including net tax impacts. We believe adjusted earnings per share, excluding spin-off impact, is a measure that is useful to investors and management in understanding our ongoing operations and in analysis of ongoing operating trends. | | | | | | | | | A-1
112 | |
| | | |Notice and Proxy Statement | 2021
| | | 2022 |
APPENDIX A: RECONCILIATION OF NON-GAAP FINANCIAL MEASURES
| | | A-1 | | | APPENDIX A:
RECONCILIATION OF NON-GAAP FINANCIAL MEASURES
|
(3) Reconciliation of Segment Profit to Operating Income and Calculation of Segment Profit and Operating Income Margins | | | | | | | | | | | | | | | | | | | | | | | | | | | ($M) | | 2017 | | | 2019 | | | 2020 | | | | | | | | | | | | | | | Segment profit | | $ | 7,690 | | | $ | 7,739 | | | $ | 6,665 | | Stock compensation expense(1) | | | (176 | ) | | | (153 | ) | | | (168 | ) | Repositioning, Other(2,3) | | | (962 | ) | | | (598 | ) | | | (641 | ) | Pension and other postretirement service costs(4) | | | (249 | ) | | | (137 | ) | | | (160 | ) | | | | | | | | | | | | | | Operating income | | $ | 6,303 | | | $ | 6,851 | | | $ | 5,696 | | | | | | | | | | | | | | | Segment profit | | $ | 7,690 | | | $ | 7,739 | | | $ | 6,665 | | ÷ Sales | | $ | 40,534 | | | $ | 36,709 | | | $ | 32,637 | | | | | | | | | | | | | | | Segment profit margin % | | | 19.0 | % | | | 21.1 | % | | | 20.4 | % | | | | | | | | | | | | | | Operating income | | $ | 6,303 | | | $ | 6,851 | | | $ | 5,696 | | ÷ Sales | | $ | 40,534 | | | $ | 36,709 | | | $ | 32,637 | | | | | | | | | | | | | | | Operating income margin % | | | 15.6 | % | | | 18.7 | % | | | 17.5 | % | | | | | | | | | | | | | | | | | | | | | | | | | | | |
(1) | Amounts included in Selling, general and administrative expenses.
|
(2) | Includes repositioning, asbestos, environmental expenses and equity income adjustment.
|
(3) | Amounts included in Cost of products and services sold, Selling, general and administrative expenses, and Other income/expense.
|
(4) | Amounts included in Cost of products and services sold and Selling, general and administrative expenses.
|
| | | | | | | | | | | | | | | | | | | | | | | | | | | | | | | | | | ($M) | 2018 | 2019 | | 2020 | | 2021 | | Segment profit | $ | 8,190 | | $ | 7,739 | | $ | 6,665 | | $ | 7,212 | | Stock compensation expense(1) | | (175) | | | (153) | | | (168) | | | (217) | | Repositioning, Other(2,3) | | (1,100) | | | (598) | | | (641) | | | (636) | | Pension and other postretirement service costs(4) | | (210) | | | (137) | | | (160) | | | (159) | | | Operating income | $ | 6,705 | | $ | 6,851 | | $ | 5,696 | | $ | 6,200 | | | Segment profit | $ | 8,190 | | $ | 7,739 | | $ | 6,665 | | $ | 7,212 | | | ÷ Sales | $ | 41,802 | | $ | 36,709 | | $ | 32,637 | | $ | 34,392 | | | Segment profit margin % | | 19.6% | | 21.1% | | | 20.4% | | | 21.0% | | Operating income | $ | 6,705 | | $ | 6,851 | | $ | 5,696 | | $ | 6,200 | | | ÷ Sales | $ | 41,802 | | $ | 36,709 | | $ | 32,637 | | $ | 34,392 | | | Operating income margin % | | 16.0% | | 18.7% | | | 17.5% | | | 18.0% |
(1)Included in Selling, general and administrative expenses. (2)Includes repositioning, asbestos, environmental expenses, equity income adjustment, and other charges. For the twelve months ended December 31, 2021, other charges include $105 million of incremental long-term contract labor cost inefficiencies due to severe supply chain disruptions (attributable to the COVID-19 pandemic) related to the warehouse automation business within the Safety and Productivity Solutions segment. These costs include incurred amounts and provisions for anticipated losses recognized during the fourth quarter when total estimated costs at completion for certain of the business’ long-term contracts exceeded total estimated revenue. These certain costs represent unproductive labor costs due to unexpected supplier delays and the resulting downstream installation issues, demobilization and remobilization of contract workers, and resolution of contractor disputes. (3)Included in Cost of products and services sold, Selling, general and administrative expenses, and Other income/expense. (4)Included in Cost of products and services sold and Selling, general and administrative expenses. We define segment profit as operating income, excluding stock compensation expense, pension and other postretirement service costs, and repositioning and other charges. We believe these measures are useful to investors and management in understanding our ongoing operations and in analysis of ongoing operating trends. (4) Reconciliation of Sales to Sales Excluding Spin-off Impact | | | | | | | | | | | ($M) | | 2017 | | | | | | | Sales | | $ | 40,534 | | Spin-off impact(1) | | | (7,630 | ) | | | | | | Sales excluding spin-off impact | | $ | 32,904 | | | | | | | | | | | | |
(1) | Amount computed as the portion of Aerospace and Honeywell Building Technologies sales in 2017 attributable to the Transportation Systems and Homes and Global Distribution spin-off businesses.
|
(5) Reconciliation of Adjusted Net Income
| | | | | | | | | | | | | | | | | | | | | | | | | | | ($M) | | 2018 | | | 2019 | | | 2020 | | | | | | | | | | | | | | | Net income attributable to Honeywell | | $ | 6,765 | | | $ | 6,143 | | | $ | 4,779 | | Separation costs, includes net tax impacts | | | 732 | | | | — | | | | — | | Separation related tax adjustment | | | — | | | | — | | | | (186 | ) | Pension mark-to-market expense(1) | | | 28 | | | | 94 | | | | 33 | | Impacts from U.S. Tax Reform | | | (1,494 | ) | | | (281 | ) | | | — | | Garrett related adjustment(2) | | | — | | | | — | | | | 427 | | | | | | | | | | | | | | | Adjusted net income attributable to Honeywell | | $ | 6,031 | | | $ | 5,956 | | | $ | 5,053 | | | | | | | | | | | | | | | | | | | | | | | | | | | | |
(1) | Pension mark-to-market expense uses a blended tax rate of 24%, 24%, 25% in 2018, 2019, 2020.
|
(2) | Represents a $427 million adjustment net of tax due to the non-cash charges associated with the reduction in value of reimbursement receivables due from Garrett, net of proceeds from settlement of related hedging transactions.
|
| | | | |
| | | Notice and Proxy Statement | 2021
| | A-2
|
| | | A-1 | | | APPENDIX A:
RECONCILIATION OF NON-GAAP FINANCIAL MEASURES
|
(6) Reconciliation of Segment Profit to Operating Income and Calculation of Decremental Margin
| | | | | | | | | | | | | | | | | | | | | | | | | | | | | | | | | | | | | | | | | | | | | | | | | | | ($M) | | 2Q19 | | | 3Q19 | | | 4Q19 | | | 2Q20 | | | 3Q20 | | | 4Q20 | | | | | | | | | | | | | | | | | | | | | | | | | | | Sales | | $ | 9,243 | | | $ | 9,086 | | | $ | 9,496 | | | $ | 7,477 | | | $ | 7,797 | | | $ | 8,900 | | Segment profit | | | 1,970 | | | | 1,928 | | | | 2,032 | | | | 1,385 | | | | 1,553 | | | | 1,879 | | Stock compensation expense(1) | | | (34 | ) | | | (37 | ) | | | (41 | ) | | | (34 | ) | | | (40 | ) | | | (50 | ) | Repositioning, Other(2,3) | | | (137 | ) | | | (109 | ) | | | (259 | ) | | | (295 | ) | | | (161 | ) | | | (111 | ) | Pension and other postretirement service costs(4) | | | (37 | ) | | | (30 | ) | | | (37 | ) | | | (38 | ) | | | (41 | ) | | | (42 | ) | Operating income | | $ | 6,303 | | | $ | 6,851 | | | $ | 5,696 | | | $ | 6,303 | | | $ | 6,851 | | | $ | 5,696 | | | | | | | | | | | | | | | | | | | | | | | | | | | Year-over-year change in Segment Profit | | | | | | | | | | | | | | $ | (585 | ) | | $ | (375 | ) | | $ | (153 | ) | ÷ Year-over-year change in Sales | | | | | | | | | | | | | | $ | (1,766 | ) | | $ | (1,289 | ) | | $ | (596 | ) | | | | | | | | | | | | | | | | | | | | | | | | | | Decremental Margin | | | | | | | | | | | | | | | 33 | % | | | 29 | % | | | 26 | % | | | | | | | | | | | | | | | | | | | | | | | | | | | | | | | | | | | | | | | | | | | | | | | | | | | |
(1) | Amounts included in Selling, general and administrative expenses.
|
(2) | Includes repositioning, asbestos, environmental expenses and equity income adjustment.
|
(3) | Amounts included in Cost of products and services sold, Selling, general and administrative expenses, and Other income/expense.
|
(4) | Amounts included in Cost of products and services sold and Selling, general and administrative expenses.
|
We define segment profit as operating income, excluding stock compensation expense, pension and other postretirement service costs, and repositioning and other charges. We believe these measures are useful to investors and management in understanding our ongoing operations and in analysis of ongoing operating trends.
(7) Reconciliation of Organic Sales % Change
| | | | | | | | | | | | | | | | | | | | | | | | | | | | | | | | | | | | | | 1Q20 | | | 2Q20 | | | 3Q20 | | | 4Q20 | | | | | | | | | | | | | | | | | | | Reported sales % change | | | (5 | )% | | | (19 | )% | | | (14 | )% | | | (6 | )% | Less: Foreign currency translation | | | (1 | )% | | | (1 | )% | | | — | % | | | 1 | % | Less: Acquisitions, divestitures and other, net | | | — | % | | | — | % | | | — | % | | | — | % | | | | | | | | | | | | | | | | | | Organic sales % change | | | (4 | )% | | | (18 | )% | | | (14 | )% | | | (7 | )% | | | | | | | | | | | | | | | | | | | | | | | | | | | | | | | | | | | |
| | | | | | | | | | | | | | | | | | | | | | | | | | | | | | | 1Q21 | | 2Q21 | | 3Q21 | | 4Q21 | | 2021 | | Reported sales % change | —% | | 18% | | 9% | | (3)% | | 5% | | Less: Foreign currency translation | 2% | | 3% | | 1% | | (1)% | | 1% | | Less: Acquisitions, divestitures, and other, net | —% | | —% | | —% | | —% | | —% | | Organic sales % change | (2)% | | 15% | | 8% | | (2)% | | 4% |
We define organic sales percent change as the year-over-year change in reported sales relative to the comparable period, excluding the impact on sales from foreign currency translation, and acquisitions, net of divestitures.divestitures, for the first 12 months following the transaction date. We believe this measure is useful to investors and management in understanding our ongoing operations and in analysis of ongoing operating trends. (8)
(5) Reconciliation of SPS Organic Sales % ChangeCash Provided by Operating Activities to Free Cash Flow and Calculation of Free Flow Margin | | | | | | | | | | | | | ($M) | | | | | | | Twelve Months Ended December 31, 2021 | | Cash provided by operating activities | | 2020 | | | | | $ | 6,038 | | | Expenditures for property, plant and equipment | | | | | | | (895) | | | Garrett cash receipts | | | | | | | 586 | | | Free cash flow | | | | | | | 5,729 | | | | | | | | | | Reported sales % change
| | | 6 | % | | | | Less: Foreign currency translation
Cash provided by operating activities | | | — | % | | | $ | 6,038 | | Less: Acquisitions, divestitures and other, net
÷ Net sales | | | — | | | | $ | 34,392 | | | Operating cash flow margin % | | | | | | | 17.6 | % | | Free cash flow | | | | | | | $ | 5,729 | | | ÷ Net sales | | | | | | | $ | 34,392 | | | Free cash flow margin % | | | | | | | 16.7 | % |
We define free cash flow as cash provided by operating activities less cash expenditures for property, plant and equipment plus cash receipts from Garrett. We define free cash flow margin as free cash flow divided by net sales. | | | | | | | | | | | | | Notice and Proxy Statement | 2022 | | | | Organic sales % change
| | | 6 | % | | | | | | | | | | 113 |
APPENDIX A: RECONCILIATION OF NON-GAAP FINANCIAL MEASURES We believe that free cash flow is a non-GAAP metric that is useful to investors and management as a measure of cash generated by operations that will be used to repay scheduled debt maturities and can be used to invest in future growth through new business development activities or acquisitions, pay dividends, repurchase stock or repay debt obligations prior to their maturities. This metric can also be used to evaluate our ability to generate cash flow from operations and the impact that this cash flow has on our liquidity. (6) Reconciliation of Adjusted Net Income | | | | | | | | | | | | | | | | | | | | | | | | | | | | ($M) | 2018 | 2019 | 2020 | 2021 | | Net Income attributable to Honeywell | $ | 6,765 | | $ | 6,143 | | $ | 4,779 | | $ | 5,542 | | | Separation related tax adjustment | | — | | | — | | | (186) | | | — | | Pension mark-to-market expense(1) | | 28 | | | 94 | | | 33 | | | 30 | | | Impacts of U.S. Tax Reform | | (1,494) | | | (281) | | | — | | | — | | Garret related adjustment(2) | | — | | | — | | | 427 | | 7 | | Changes in fair value of equity related securities | | — | | | — | | | — | | | (19) | | | Gain on sale of retail footwear business | | — | | | — | | | — | | | (76) | | | Expense related to UOP Matters | | — | | | — | | | — | | | 160 | | Separation Costs, includes net tax impacts | | 732 | | | — | | | — | | | — | | | Adjusted net income attributable to Honeywell | $ | 6,031 | | $ | 5,956 | | $ | 5,053 | | $ | 5,644 | |
(1)Pension mark-to-market expense uses a blended tax rate of 24%, 24%, 25%, and 25% in 2018, 2019, 2020, and 2021. (2)For the twelve months ended December 31, 2021, the adjustment was $7 million net of tax due to a non-cash charge associated with a further reduction in value of reimbursement receivables following Garrett's emergence from bankruptcy on April 30, 2021. For the twelve months ended December 31, 2020, the adjustment was $427 million net of tax due to the non-cash charges associated with the reduction in value of reimbursement receivables due from Garrett, net of proceeds from settlement of related hedging transactions. We define organic sales percent changeadjusted net income attributable to Honeywell as net income attributable to Honeywell adjusted for certain items as presented above. (7) Reconciliation of Segment Profit to Operating Income and Calculation of Incremental Margin | | | | | | | | | | | | | | | | | | | ($M) | 2020 | | 2021 | | Net sales | $ | 32,637 | | | | 34,392 | | | Segment profit | $ | 6,665 | | $ | 7,212 | | Stock compensation expense(1) | | (168) | | | (217) | | Repositioning, Other(2,3) | | (641) | | | (636) | | Pension and other postretirement service costs(4) | | (160) | | | (159) | | | Operating income | $ | 5,696 | | $ | 6,200 | | | Year-over-year change in Segment profit | | | | $ | 547 | | | ÷ Year-over-year change in Net sales | | | | $ | 1,755 | | | Incremental Margin % | | | | | 31.2 | % |
(1)Included in Selling, general and administrative expenses. (2)Includes repositioning, asbestos, environmental expenses, equity income adjustment, and other charges. For the twelve months ended December 31, 2021, other charges include $105 million of incremental long-term contract labor cost inefficiencies due to severe supply chain disruptions (attributable to the COVID-19 pandemic) related to the warehouse automation business within the Safety and Productivity Solutions segment. These costs include incurred amounts and provisions for anticipated losses recognized during the fourth quarter when total estimated costs at completion for certain of the business’ long-term contracts exceeded total estimated revenue. These certain costs represent unproductive labor costs due to unexpected supplier delays and the resulting downstream installation issues, demobilization and remobilization of contract workers, and resolution of contractor disputes. (3)Included in Cost of products and services sold, Selling, general and administrative expenses, and Other income/expense. (4)Included in Cost of products and services sold and Selling, general and administrative expenses. We define segment profit as operating income, excluding stock compensation expense, pension and other postretirement service costs, and repositioning and other charges. We define incremental margin as the year-over-year change in reported sales relative tosegment profit divided by the comparable period, excluding the impact on sales from foreign currency translation, and acquisitions,year-over-year change in net of divestitures.sales. We believe this measure isthese measures are useful to investors and management in understanding our ongoing operations and in analysis of ongoing operating trends. | | | | | | | | | A-3
114 | |
| | | |Notice and Proxy Statement | 2021
| | | 2022 |
This page intentionally left blank.
CORPORATE REPUTATION AWARDS Corporate Reputation AwardsWorld’s Most Admired Companies
Fortune Magazine. 2006-2020
America’s Top 100 Most Reputable2006-2021
World's Best Employers
Forbes. 2021 America's Safest CompaniesForbes Magazine. 2018-2019
EHS Today. 2021 Most Honored Company
Institutional Investor. 2015-2020Canada’s Best Employers
Forbes Magazine. 2018
Most Innovative In-House Legal Team
Financial Times. 2018
Innovation in Managing Complexity and Scale
Financial Times. 2018
2015-2021 Most Innovative Lawyers Award, Digital Transformation
Financial Times. 2020Corporate Ethics
Golden Peacock Award. 2018
Top Military Friendly Employer
G.I. Jobs Magazine. 2013-2018
Best Corporations for Veterans Business Enterprises
National Veteran Owned Business Association. 2017
Top 25 Best Places to Work in Mexico
Glassdoor. 2020 Corporate Ethics
Golden Peacock Award. 2018, 2020 America’s Top 100 Most Reputable Companies
Forbes Magazine. 2018-2019 Best Business Tools
Newsweek. 2019 Leadership AwardsCanada’s Best Employers
Forbes Magazine. 2018
Most Innovative In-House Legal Team
Financial Times. 2018 Innovation in Managing Complexity and Scale
Financial Times. 2018 Top Military Friendly Employer
G.I. Jobs Magazine. 2013-2018 Best Corporations for Veterans Business Enterprises
National Veteran Owned Business Association. 2017 LEADERSHIP AWARDS Forbes CEO Next 50, Que Dallara
Forbes, 2021 Most Admired CEO Award, Darius Adamczyk
Charlotte Business Journal. 2020100 People Transforming Business, Que Dallara
Business Insider, 2020
Best CEO, Darius Adamczyk
Institutional Investor. 2018-2019 Best CFO, Gregory P. Lewis
Institutional Investor. 2019 Global GC 20, Anne T. Madden
Financial Times. 2019 General Council Global 100 Influencer USA, Anne T. Madden
Chambers. 2019 Corporate Social Responsibility Award, Darius Adamczyk
Foreign Policy Association. 2018 Engineering Alumni Award, Darius Adamczyk
Michigan State University. 2018 DIVERSITY AWARDS Top 100 Diversity Officer, Cheya Dunlap
Diversity AwardsFirst, 2022 Most Influential Black Corporate Directors, Deborah Flint
Savoy Magazine. 2021 Most Influential Black Corporate Directors, Robin L. Washington
Savoy Magazine. 2021, 2017 Top 50 Employers List
Minority Engineer Magazine. 2019 Women Worth Watching
Diversity Journal. 2005, 2007, 2010-2019 Best for Vets: Employers
Military Times. 2017, 2019 Corporate Visionary Award
Latino Corporate Directors Association. 2018 Leadership in the Promotion of Diversity
NJ LEEP. 2018 Top 12 Employer
Women Engineer Magazine. 2018Women Worth Watching
Diversity Journal. 2005, 2007, 2010-2019
Corporate Board Gender Diversity Award
Executive Women of New Jersey. 2014, 2015, 2017Best for Vets: Employers
Military Times. 2017, 2019
Most Influential Black Corporate Directors, Robin L. Washington
Savoy Magazine. 2017
TECHNOLOGY AWARDS Technology AwardsWorld’s Most Innovative Companies
Fast Company. 2021
Top 100 Global Innovators
Clarivate Analytics. 2018
Global Customer Value Leadership Award
Frost and Sullivan. 2019 Financial Management AwardsTop 100 Global Innovators
Clarivate Analytics. 2018
FINANCIAL MANAGEMENT AWARDS Top 100 Companies
NAIC/BetterInvesting. 2021 All-America Executive Team
Institutional Investor, 2021 Best Investor Relations Program
Institutional Investor. 2012-2015, 2017-2019 Best Investor Relations Professional
Institutional Investor. 2014, 2017-2019 Best Analyst Day/Investor Meetings
Institutional Investor. 2015-2019 / IR Magazine. 2018Global Top 50 Gold
IR Magazine. 2015, 2017
Best IR in Sector
Institutional Investor. 2014, 2017, 2019 Overall Top Treasury Team
Treasury Today Magazine Adam Smith Awards. 2019 Best Fintech Solution
Treasury Today Magazine Adam Smith Awards. 2019 Corporate Responsibility AwardsGlobal Top 50 Gold
IR Magazine. 2015, 2017
CORPORATE RESPONSIBILITY AWARDS World’s Most Ethical Companies
Ethisphere Institute. 2020-2021 Environmental Stewardship Innovator Award
Loyola University Chicago. 2021 Corporate Citizenship Award, Large Company
Boston College Center for Corporate Citizenship. 2021 Golden Peacock Award, Corporate Social Responsibility
Institute of Directors. 2021 Best ESG/SRI Metrics
Institutional Investor. 2018-2019Top 2018 Corporate Social Responsibility Influence Leaders
Assent Compliance. 2018
Voluntary Protection Program
OSHA and Industrial Commission of Arizona. 2018
Best Safety Organization
Ministry of Labor Thailand. 2018
CSR China Education Award
Central Committee of the Communist Youth League of China. 2018
Invest in Education
Junior Achievement Romania. 2018—2019
Hope Award
National Center for Missing and Exploited Children. 2018
CSR Foundation of the Year Award – Honeywell India
India CSR Summit. 2019 PR Daily’s CSR Awards
‘Cause Advocacy Campaign’ for Safe Water Network. 2019
PR Daily’s CSR Awards
Education or Scholarship Program’ forHoneywell Educators at Space Academy. 2019 Stevie Health, Safety & Environment Program of the Year
Asia, Australia and New Zealand GOLD Award for Safe Water Network Initiative. 2019 Stevie “Corporate Social Responsibility Program of the Year”
Asia, Australia and New Zealand BRONZE Award for Connected Labs Initiative. 2019 North America SABRE Award “Chemicals & Industrial” Finalist
Safe Kids-Malaysia. 2019 Invest in Education
Junior Achievement Romania. 2018-2019 Top 2018 Corporate Social Responsibility Influence Leaders Assent
Compliance. 2018 Voluntary Protection Program
OSHA and Industrial Commission of Arizona. 2018 Best Safety Organization
Ministry of Labor Thailand. 2018 CSR China Education Award
Central Committee of the Communist Youth League of China. 2018 Hope Award
National Center for Missing and Exploited Children. 2018
| | | | |
| | |
Notice and Proxy Statement | 2021
| | |

| | | 
| | 
VOTE BY INTERNET
Before The Meeting - Go to www.proxyvote.com or scan the QR Barcode above
| | Use the Internet to transmit your voting instructions and for electronic delivery of information up until 11:59 p.m. Eastern Daylight Time on May 20, 2021. If you participate in the Honeywell 401(k) Plan or the Honeywell Puerto Rico Savings and Ownership Plan, you must vote these shares no later than 5:00 p.m. EDT on May 18, 2021. Have your proxy card in hand when you access the website and then follow the instructions to obtain your records and to create an electronic voting instruction form.
During The Meeting - Go to www.virtualshareholdermeeting.com/HON2021
You may attend the meeting via the Internet and vote during the meeting. Have the information that is printed in the box marked by the arrow available and follow the instructions.
| | VOTE BY PHONE - 1-800-690-6903 | | Use any touch-tone telephone to transmit your voting instructions up until 11:59 p.m. Eastern Daylight Time on May 20, 2021. If you participate in the Honeywell 401(k) Plan or the Honeywell Puerto Rico Savings and Ownership Plan, you must vote these shares no later than 5:00 p.m. EDT on May 18, 2021. Have your proxy card in hand when you call and then follow the instructions.
| | VOTE BY MAIL | | Mark, sign and date your proxy card and return it in the postage-paid envelope we have provided or return it to Vote Processing, c/o Broadridge, 51 Mercedes Way, Edgewood, NY 11717. |
| | | | | TO VOTE, MARK BLOCKS BELOW IN BLUE OR BLACK INK AS FOLLOWS: | | | | | D28531-P47941-Z78821 | | KEEP THIS PORTION FOR YOUR RECORDS |
— — — — — — — — — — — — — — — — — — — — — — — — — — — — — — — — — — — — — — — — — — — — — — — —
| | | | | | | | | DETACH AND RETURN THIS PORTION ONLY | HONEYWELL INTERNATIONAL INC. | | THIS PROXY CARD IS VALID ONLY WHEN SIGNED AND DATED.
| | |
| | | | | | | | | | | | | | | | | | | | | | | | | | | | | | | | | | | | | | | | | | | | | | 1.
| | Election of Directors: | | | | | | | | | | | | | | | | | | | | | The Board of Directors recommends a vote “FOR”
Nominees (A) through (K). | | | | | | | | | | | | | | | | | 
For
| | | | Against
| | | | | | | | | | | | | A.
B.
C.
D.
E.
F.
G.
H.
I.
J.
K.
| | Darius Adamczyk
Duncan B. Angove
William S. Ayer
Kevin Burke
D. Scott Davis
Deborah Flint
Judd Gregg
Grace D. Lieblein
Raymond T. Odierno
George Paz
Robin L. Washington
| | ☐
☐
☐
☐
☐
☐
☐
☐
☐
☐
☐
| | | | ☐
☐
☐
☐
☐
☐
☐
☐
☐
☐
☐
| | | | | | | | | | | | | | | | | | | | | | | | | | | | | | | | | | The Board of Directors recommends a vote “FOR”
Proposals (2) and (3). | | | | | | | | | | |
For
| | Against | | Abstain | | | | | | | 2.
| | Advisory Vote to Approve Executive Compensation.
| | ☐ | | ☐ | | ☐ | | | | | | | 3.
| | Approval of Independent Accountants. | | ☐ | | ☐ | | ☐ | | | | | | | | | The Board of Directors recommends a vote “AGAINST”
Proposals (4).
| | | | | | | | | | | For | |
Against
| | Abstain | | | | | | | 4.
| | Shareholder Right To Act By Written Consent. | | ☐ | | ☐ | | ☐ | | | | | | | | | | | | | | | | | | | | | | | | | | | | | | | | | | | | | | | | | | | | | | | | | | | | | | | | | | | | | | | | | | | | | | | | | | | | | | | | | | Signature [PLEASE SIGN WITHIN BOX] | | Date | | | | | | | | Signature (Joint Owners) | | Date | | | | | | | | | | | | | | | | | | | For more information www.honeywell.com | | | | | | | | | | | | | | | | | | | | | | |
Important Notice Regarding Availability of Proxy Materials: The 2021 Notice and Proxy Statement and 2020 Annual Report are available at www.proxyvote.com.
— — — — — — — — — — — — — — — — — — — — — — — — — — — — — — — — — — — — — — — — — — — — — — — — — — — — — — — — — — — —
D28532-P47941-Z78821
| | | | | | | | | | | | | | | | | PROXY
HONEYWELL
This Proxy is Solicited on Behalf of the Board of Directors of© 2022 Honeywell International Inc.
Annual Meeting of Shareowners - May 21, 2021
The undersigned hereby appoints Darius Adamczyk, Anne T. Madden, and Victor J. Miller as proxies (each with the power to act alone and with full power of substitution) to vote, as designated herein, all shares the undersigned is entitled to vote at the Annual Meeting of Shareowners of Honeywell International Inc. to be held on May 21, 2021, and at any and all adjournments thereof. The proxies are authorized to vote in their discretion upon such other business as may properly come before the Meeting and any and all adjournments thereof.
Your vote on the election of Directors and the other proposals described in the accompanying Proxy Statement may be specified on the reverse side. The nominees for Director are: Darius Adamczyk, Duncan B. Angove, William S. Ayer, Kevin Burke, D. Scott Davis, Deborah Flint, Judd Gregg, Grace D. Lieblein, Raymond T. Odierno, George Paz, and Robin L. Washington.
IF PROPERLY SIGNED, DATED AND RETURNED, THIS PROXY WILL BE VOTED AS SPECIFIED ON THE REVERSE SIDE OR, IF NO CHOICE IS SPECIFIED, THIS PROXY WILL BE VOTED “FOR” THE ELECTION OF ALL NOMINEES FOR DIRECTOR, “FOR” PROPOSALS 2 AND 3 AND “AGAINST” PROPOSAL 4. PLEASE NOTE: PHONE AND INTERNET VOTING CUTOFF IS 11:59 PM EDT ON May 20, 2021.
This instruction and proxy card is also solicited by the Board of Directors of Honeywell International Inc. (the “Company”) for use at the Annual Meeting of Shareowners on May 21, 2021 by persons who participate in the Honeywell 401(k) Plan or the Honeywell Puerto Rico Savings and Ownership Plan. PHONE AND INTERNET VOTING CUTOFF FOR SAVINGS PLAN PARTICIPANTS IS 5:00 PM EDT ON May 18, 2021.
By signing this instruction and proxy card, or by voting by phone or Internet, the undersigned hereby directs The Northern Trust Company, as Trustee for the Honeywell 401(k) Plan, and Banco Popular, as Trustee for the Honeywell Puerto Rico Savings and Ownership Plan, to vote, as designated herein, all shares of common stock with respect to which the undersigned is entitled to direct the Trustee as to voting under the plan at the Annual Meeting of Shareowners of Honeywell International Inc. to be held on May 21, 2021, and at any and all adjournments thereof. The Trustee is also authorized to vote such shares in connection with the transaction of such other business as may properly come before the Meeting and any and all adjournments thereof.
Your vote on the election of Directors and the other proposals described in the accompanying Proxy Statement may be specified on the reverse side. The nominees for Director are: Darius Adamczyk, Duncan B. Angove, William S. Ayer, Kevin Burke, D. Scott Davis, Deborah Flint, Judd Gregg, Grace D. Lieblein, Raymond T. Odierno, George Paz, and Robin L. Washington.
IF PROPERLY SIGNED, DATED AND RETURNED, THE SHARES ATTRIBUTABLE TO THE ACCOUNT WILL BE VOTED BY THE TRUSTEE AS SPECIFIED ON THE REVERSE SIDE OR, IF NO CHOICE IS SPECIFIED, SUCH SHARES WILL BE VOTED “FOR” THE ELECTION OF ALL NOMINEES FOR DIRECTOR, “FOR” PROPOSALS 2 AND 3 AND “AGAINST” PROPOSAL 4. THE TRUSTEE WILL VOTE SHARES AS TO WHICH NO DIRECTIONS ARE RECEIVED IN THE SAME RATIO AS SHARES WITH RESPECT TO WHICH DIRECTIONS HAVE BEEN RECEIVED FROM OTHER PARTICIPANTS IN THE PLAN, UNLESS CONTRARY TO ERISA.
Note: Please sign exactly as your name or names appear(s) on this Proxy. When shares are held jointly, each holder should sign. When signing as executor, administrator, attorney, trustee, or guardian, please give full title as such. If the signer is a corporation, please sign full corporate name by duly authorized officer, giving full title as such. If signer is a partnership, please sign in partnership name by authorized person.
Please date and sign your Proxy on the reverse side and return it promptly.
| | | | | | |
All rights reserved. |
FORM OF EMAIL MESSAGE REGARDING PROXY MATERIALS AND VOTING
Subject: Vote Your Shares Now: HONEYWELL INTERNATIONAL INC. Annual Meeting

| | |  | | 2021 Annual Meeting
May 21, 2021
|
Important proxy voting material is ready for your action.
This email represents the following share(s):
| | | | | HONEYWELL INTL - COMMON
| | | 123,456,789,012.00000 | | HONEYWELL 401 (K) PLAN
| | | 123,456,789,012.00000 | | HONEYWELL 401 (K) PLAN (KC - UNION)
| | | 123,456,789,012.00000 | | HONEYWELL PR SAVINGS & OWNERSHIP PLAN
| | | 123,456,789,012.00000 | | HONEYWELL PUERTO RICO SAVINGS & OWNERSHIP PLAN
| | | 123,456,789,012.00000 | | HONEYWELL INTL - SHAREBUILDER
| | | 123,456,789,012.00000 | |
| | | | | | | | | | | ThreeWays to Vote
| | | | | | | | | | | | | | | | | Now via ProxyVote | | | | | | Vote By
May 20, 2021 11:59 P.M. ET
| | | | | | | | | | | At the Virtual Meeting | | | | | | For shares held in a Plan, vote by
May 18, 2021 5:00 P.M. ET
| | | | | | | | | | By Phone 1.800.690.6903 | | | | Control Number: 0123456789012345 | | |
| Important
Materials
Annual Report
Proxy Statement
|
| Attend the Virtual Meeting
|
For holders as of March 26, 2021

 |


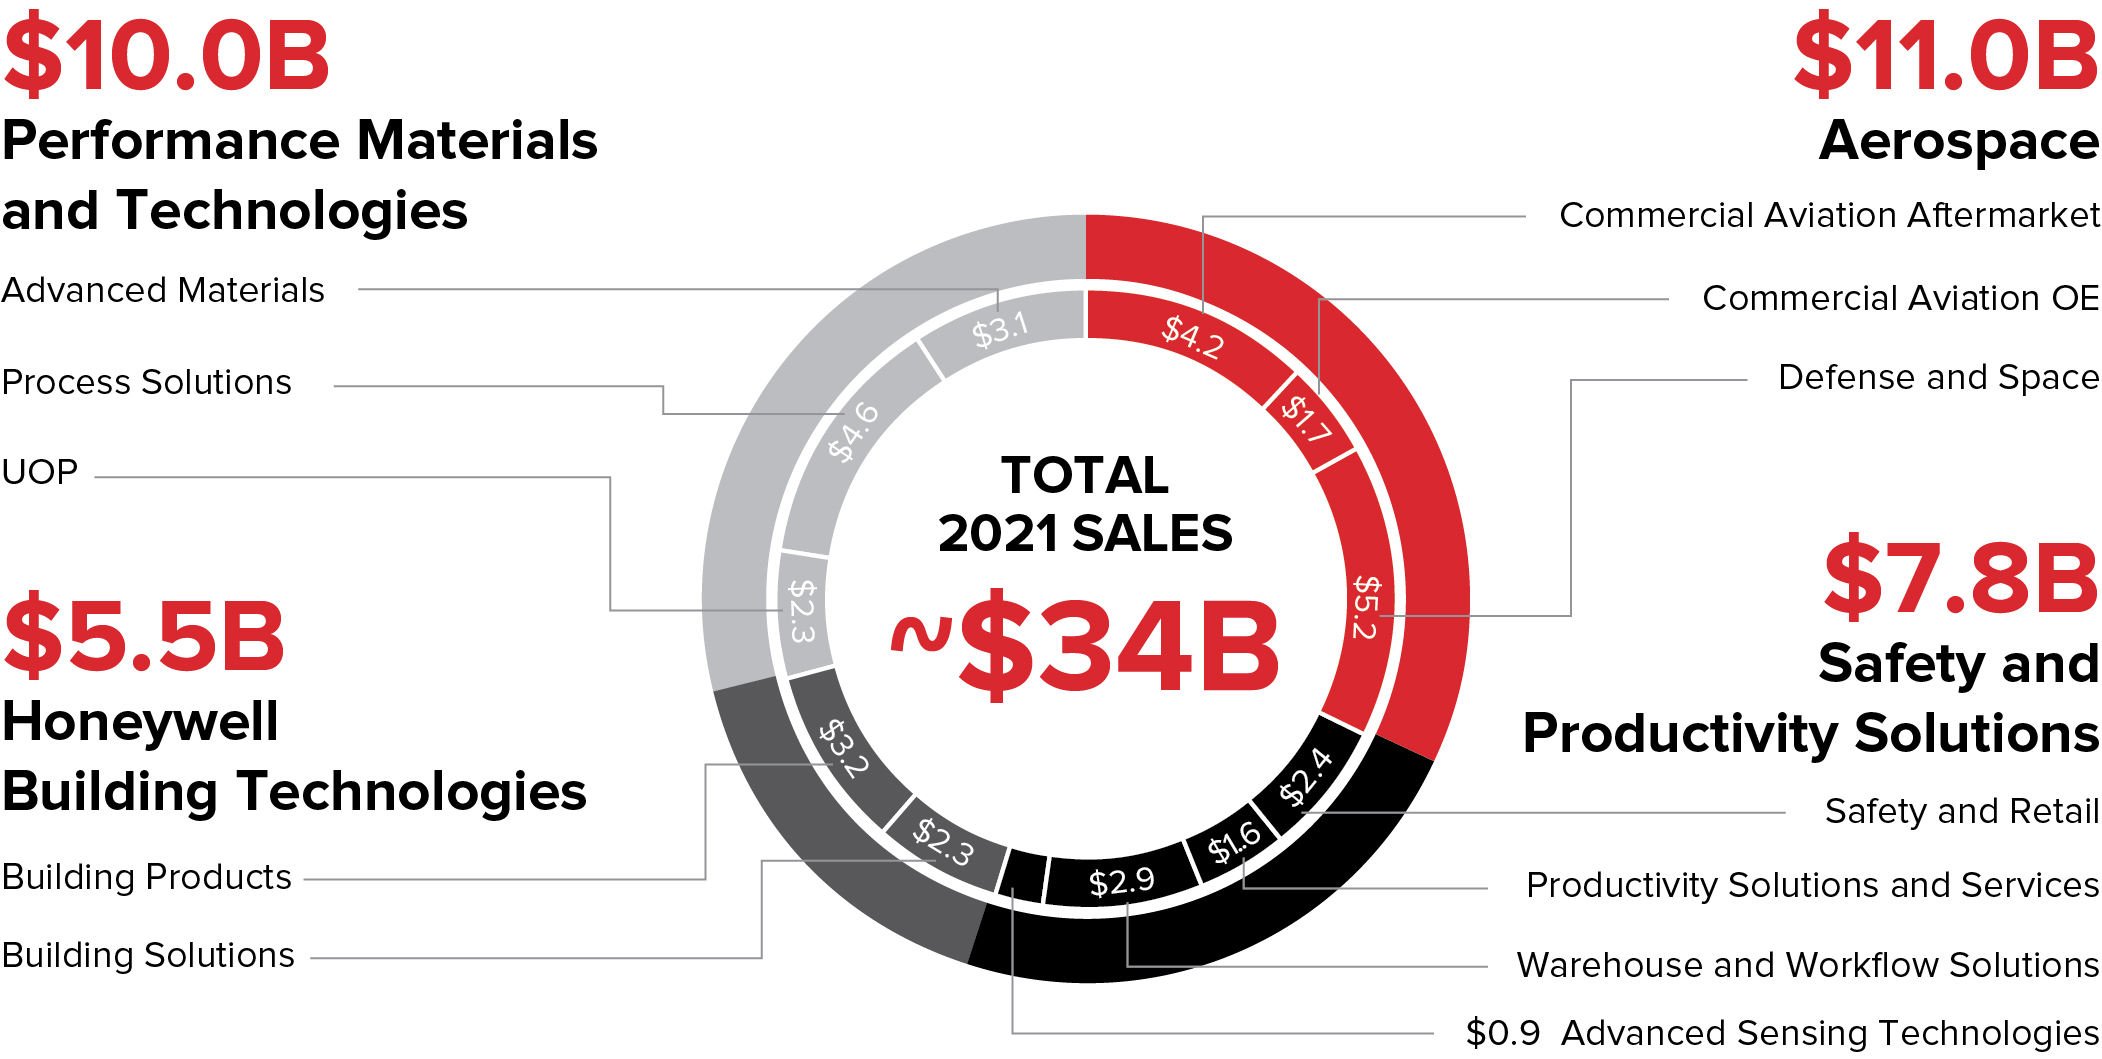
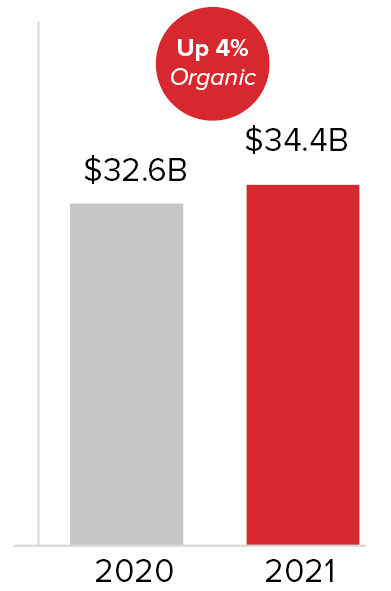
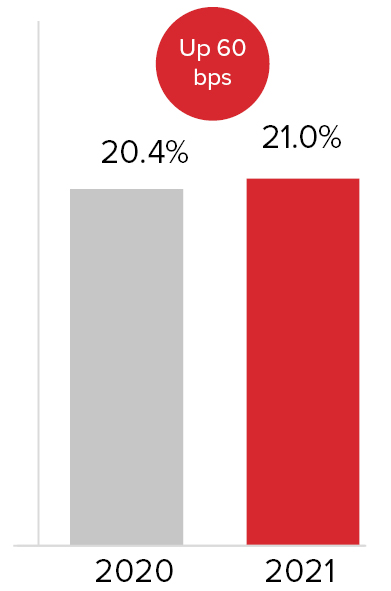
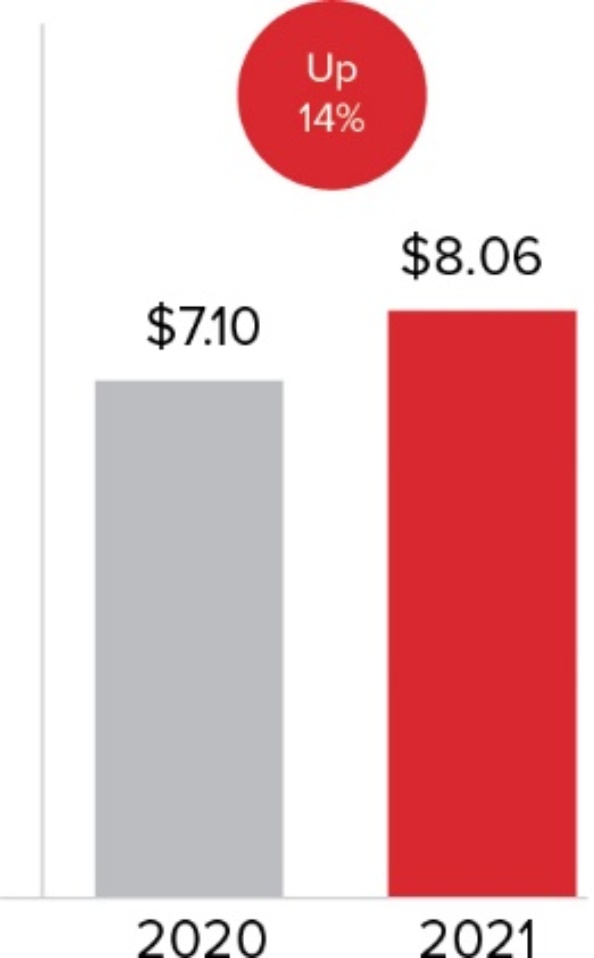
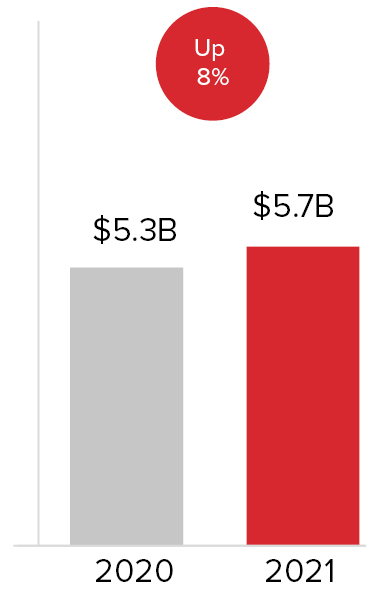
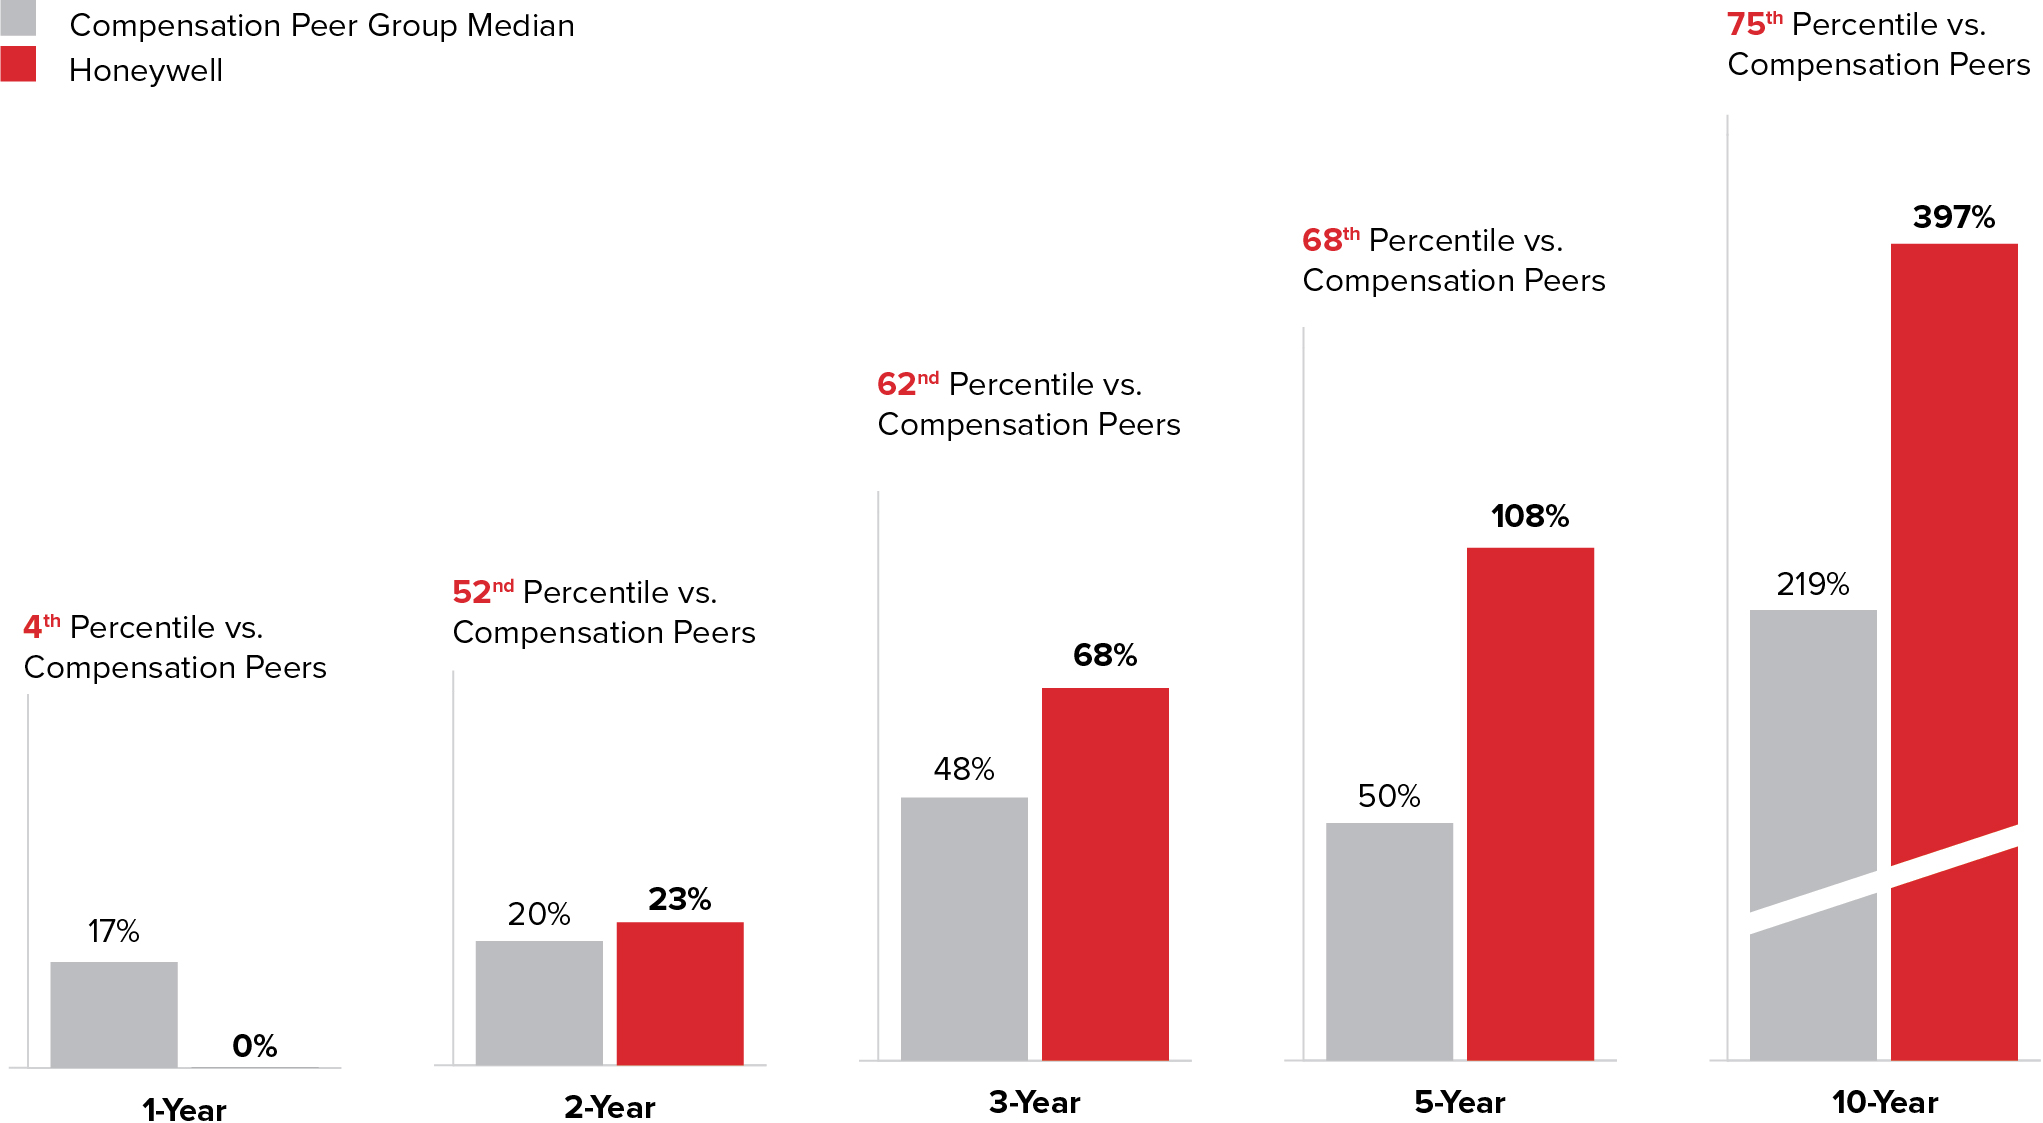


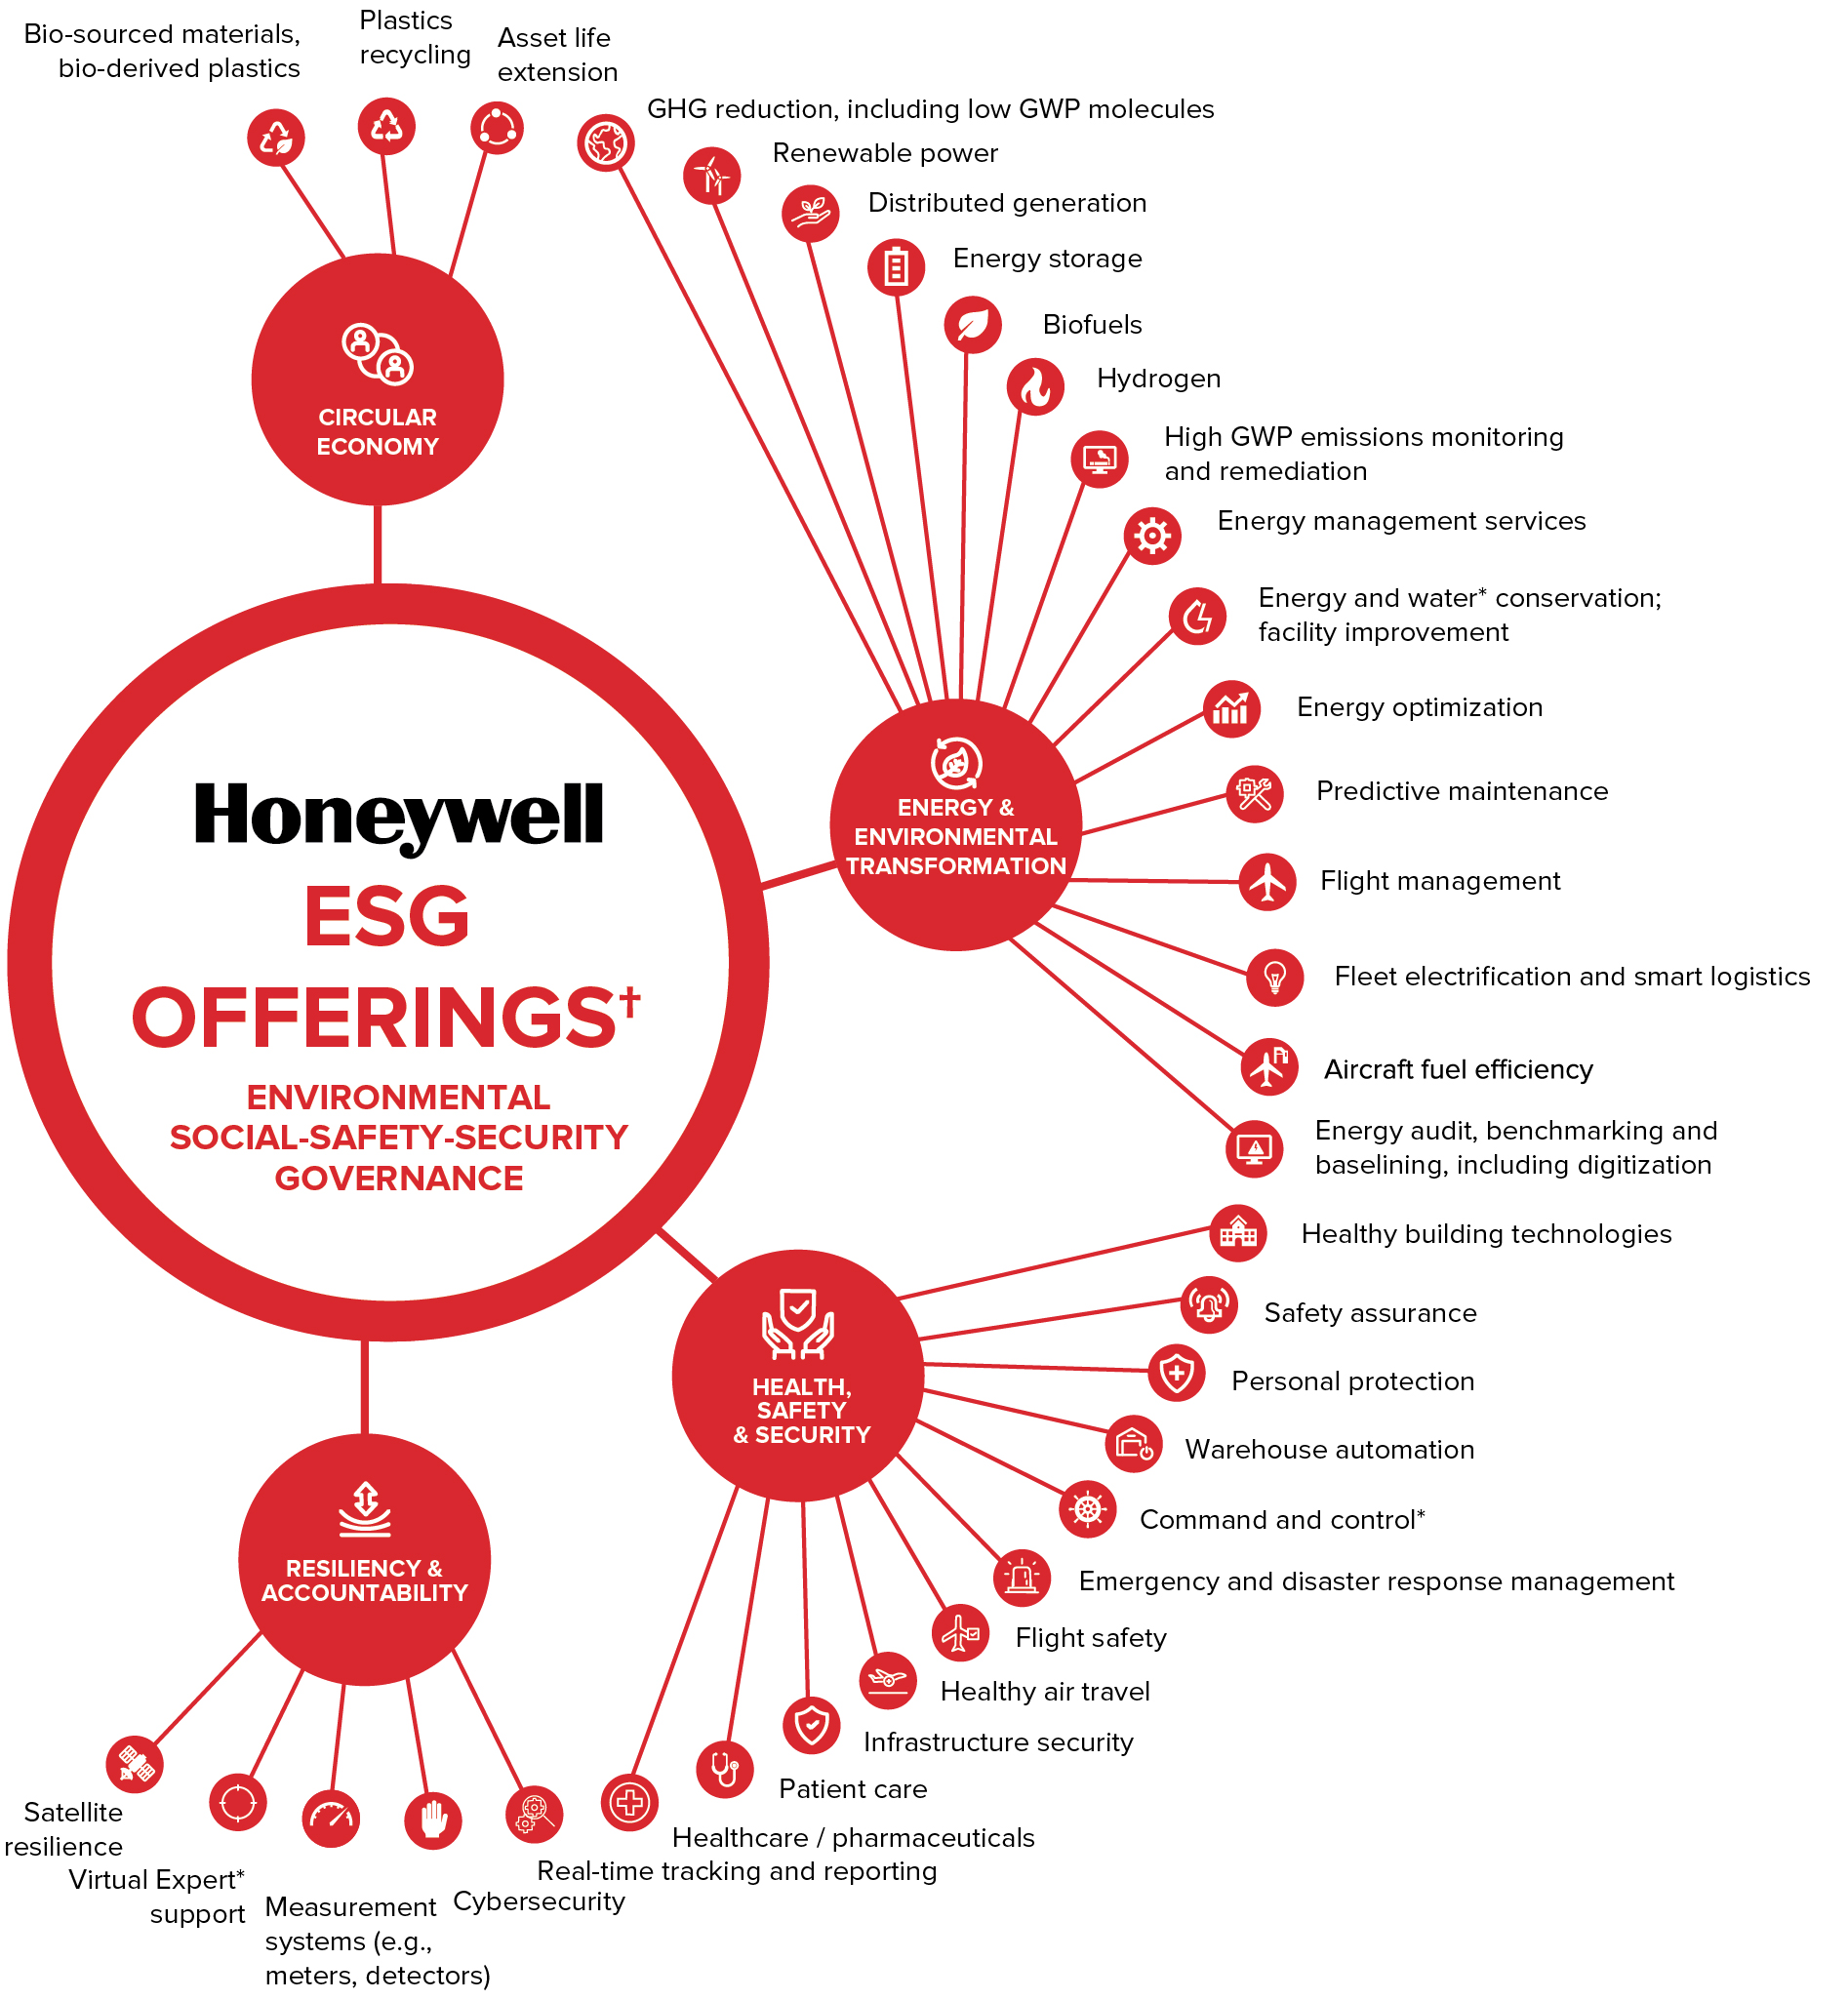
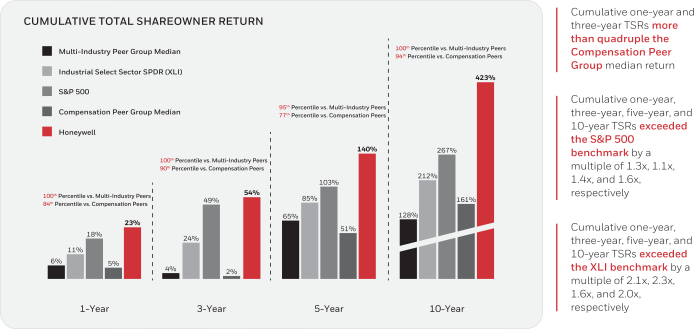


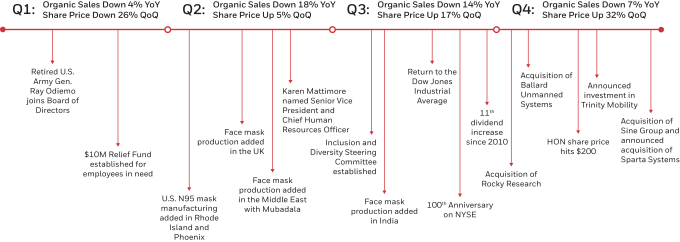
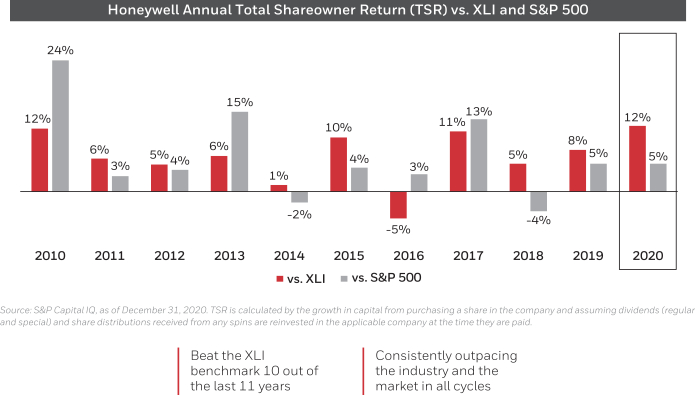

 15% threshold for shareowners to call a special meeting